ED Decision 2021/015/R
1.0 Purpose
This AMC provides information, guidelines, recommendations, and acceptable means of compliance for use by applicants in the production of performance information for aeroplanes when taking off from runways that are slippery wet or contaminated by standing water, slush, snow, and ice.
2.0 Technical
Limitations of Data
The methodology specified in this AMC provides one acceptable means of compliance with the provisions of CS 25.1591. In general it does not require aeroplane testing on contaminated runway surfaces, although such testing if carried out at the discretion of the applicant may significantly improve the quality of the result or reduce the quantity of analytical work required.
Due to the nature of naturally occurring runway contaminants and difficulties associated with measuring aeroplane performance on such surfaces, any data that is either calculated or measured is subject to limitations with regard to validity. Consequently the extent of applicability should be clearly stated.
The properties specified in this AMC for various contaminants are derived from a review of the available test and research data and are considered to be acceptable for use by applicants. This is not an implied prohibition of data for other conditions or that other conditions do not exist.
EASA acknowledges that the observing of and reporting on the type and depth of runway surface contaminants (water, slush, dry snow, wet snow) is limited. This information may not be accurately and timely relayed to the flight crew. Furthermore, shallow depths of contaminants do not generally reduce wheel braking friction below that of a wet runway, except in unfavourable circumstances where lower than expected runway condition codes (RWYCCs) are reported (see AMC 25.1592). In line with International Civil Aviation Organization (ICAO) and Federal Aviation Administration (FAA) standards, EASA considers a depth of more than 3 mm for loose contaminant accountability in take-off performance assessments a reasonable lower threshold. If the depth of such loose contaminant is lower than 3 mm, or if there is a thin layer of frost, the runway is considered wet, for which this AMC 25.1591 does not apply.
It is intended that the use of aeroplane performance data for contaminated runway conditions produced in accordance with CS 25.1591 should include recommendations associated with the operational use of the data. Where possible, this operational guidance should be provided by the applicant or its production co-ordinated with the applicant to ensure that its use remains valid.
Operators are expected to make careful and conservative judgments in selecting the appropriate performance data to use for operations on contaminated runways. Particular attention should be paid to the presence of any contaminant in the critical high speed portion of the runway. For takeoff, it may be appropriate to use different contaminant types or depths for the takeoff and the accelerate-stop portions. For example, it may be appropriate to use a greater contaminant depth or a contaminant type that has a more detrimental effect on acceleration for the takeoff portion than for the accelerate-stop portion of the takeoff analysis.
In considering the maximum depth of runway contaminants it may be necessary to take account of the maximum depth for which the engine air intakes have been shown to be free of ingesting hazardous quantities of water in accordance with CS 25.1091(d)(2).
3.0 Standard
Assumptions
Due to the wide variation in possible conditions when operating on contaminated runways and the limitations inherent in representing the effects of these conditions analytically, it is not possible to produce performance data that will precisely correlate with each specific operation on a contaminated surface. Instead, the performance data should be determined for a standardised set of conditions that will generally and conservatively represent the variety of contaminated runway conditions occurring in service.
It should be assumed that:
— the contaminant is spread over the entire runway surface to an even depth (although rutting, for example, may have taken place).
— the contaminant is of a uniform specific gravity.
— where the contaminant has been sanded, graded (mechanically levelled) or otherwise treated before use, that it has been done in accordance with agreed national procedures.
4.0 Definitions
The following definitions are a subset of the runway surface condition descriptors for which a representative take‑off performance model may be derived using the methods contained in this AMC.
4.1 Frost
Ice crystals formed from airborne moisture on a surface whose
temperature is below freezing. Frost differs from ice in that frost crystals
grow independently and, therefore, have a more granular texture.
Note 1: ‘below freezing’ refers to air temperature equal to or
lower than the freezing point of water (0 C/32°F).
Note 2: under certain conditions, frost can render the runway
surface very slippery, which should then be appropriately reported as ‘reduced
braking action’.
4.1.a Standing water
Water of a depth greater than 3mm.
Note: a surface condition where there is a layer of water of 3 mm
or less is considered wet, for which this AMC 25.1591 is not applicable.
4.2 Slush
Snow that is so water-saturated that water will drain from it when a handful is picked up or will splatter if stepped on forcefully.
4.3 Wet snow
Snow that contains enough water to be able to make a well-compacted, solid snowball, without squeezing out water.
4.4 Dry snow
Snow from which a snowball cannot readily be made.
4.5 Compacted snow
Snow that has been compacted into a solid mass such that aeroplane tyres, at operating pressures and loadings, will run on the runway surface without significant further compaction or rutting of the runway surface.
4.6 Ice
Water that has frozen or compacted snow that has transitioned into ice, in cold and dry conditions.
Note: this definition excludes wet ice that has a film of water on top of it or contains melting ice, which provides minimal braking friction and uncertain lateral control.
4.7 Slippery wet runway
A wet runway where the surface friction characteristics on a significant portion of the runway have been determined to be degraded.
4.8 Specially prepared winter runway
A runway, with a dry frozen surface of compacted snow and/or ice which has been treated with sand or grit or has been mechanically or chemically treated to improve runway friction. The runway friction is monitored and reported on a regular basis in accordance with national procedures.
4.9 Specific gravity
The density of the contaminant divided by the density of the water.
5.0 Contaminant Properties to be Considered
5.1 Range of Contaminants
The following general range of conditions or properties may by used. The list given in Table 1 is not necessarily comprehensive and other contaminants may be considered, provided account is taken of their specific properties.
Data should assume the contaminant to be uniform in properties and uniformly spread over the complete runway.
Contaminants can be classified as being:-
(i) Drag producing, for example by contaminant displacement or impingement,
(ii) Braking friction reducing, or
(iii) A combination of (i) and (ii).
Data to be produced should use the classification and assumptions of Table 1 and then the appropriate sections of the AMC as indicated.
|
Contaminant |
Range of Depths to be Considered — mm |
Specific Gravity Assumed for Calculation |
Is Drag Increased? |
Is Braking Friction Reduced below Dry Runway
Value? |
Analysis Paragraphs Relevant |
|
Standing water, Flooded runway |
More than 3 up to 15 (see Note 1) |
1.0 |
Yes |
Yes |
7.1, 7.3, 7.4 |
|
Slush |
More than 3 up to 15 (see Note 1) |
0.85 |
Yes |
Yes |
7.1, 7.3, 7.4 |
|
Wet snow |
More than 3 up to 5 (see Note 1) |
|
No |
Yes |
7.3, 7.4 |
|
Wet snow |
More than 5 |
0.5 |
Yes |
Yes |
7.1, 7.3, 7.4 |
|
Dry snow |
More than 3 (see Note 1) |
|
No |
Yes |
7.3, 7.4 |
|
Dry Snow |
More
than 10 |
0.2 |
Yes |
Yes |
7.2, 7.3, 7.4 |
|
Compacted
snow at or below outside air temperature (OAT) of |
0 (see Note 4) |
|
No |
Yes |
7.3, 7.4 |
|
Compacted snow above
OAT of |
0 (see Note 4) |
|
No |
Yes |
7.3, 7.4 |
|
Dry snow over compacted snow |
More than 10 |
0.2 |
Yes |
Yes |
7.2, 7.3, 7.4 |
|
Wet snow over compacted snow (see Note 3) |
More than 5 up |
0.5 |
Yes |
Yes |
7.1, 7.3, 7.4 |
|
Ice (cold & dry) |
0 (see Note 4) |
|
No |
Yes |
7.3, 7.4 |
|
Slippery wet |
0 (see Note 4) |
|
No |
Yes |
7.3, 7.4 |
|
Specially prepared winter runway (see Note 5) |
0 (see Note 4) |
|
No |
Yes |
7.3.4, 7.4 |
Table 1
Note 1:
Runways with water depths or slush depths or snow depths of 3 mm or less are
considered wet, for which this AMC 25.1591 is not applicable.
Note 2:
Contaminant drag may be ignored.
Note 3: For
conservatism, the same landing gear displacement and impingement drag
methodology is used for wet snow as for slush.
Note 4:
Where depths are given as zero, it is assumed that the aeroplane is rolling on
the surface of the contaminant.
Note 5: No
default model is provided for specially prepared winter runways in this AMC.
Such runway surfaces are specific, and their treatment may be of variable
effectiveness. The competent authority of the State of operator should approve
the related procedures and methods.
5.2 Other Contaminants
Table 1
lists the contaminants commonly found.
It can be seen that the complete range of conditions or specific
gravities has not been covered.
Applicants may wish to consider other, less likely, contaminants in
which case such contaminants should be defined in a manner suitable for using
the resulting performance data in aeroplane operations.
6.0 Derivation
of Performance Information
6.1 General Conditions
Take-off
performance information for contaminated runways should be determined in
accordance with the assumptions given in paragraph 7.0.
Where
performance information for different contaminants are similar, the most
critical may be used to represent all conditions.
This AMC
does not set out to provide a complete technical analytical process but rather
to indicate the elements that should be addressed. Where doubt exists with
regard to the accuracy of the methodology or the penalties derived,
consideration should be given to validation by the use of actual aeroplane
tests or other direct experimental measurements.
6.2 Take-off on a Contaminated Runway
6.2.1 Except as modified by the effects of
contaminant as derived below, performance assumptions remain unchanged from
those used for a wet runway, in accordance with the agreed certification
standard. These include accelerate-stop distance definition, time delays,
take-off distance definition, engine failure accountability and stopping means
other than by wheel brakes (but see paragraph 7.4.3).
6.2.2 Where
airworthiness or operational standards permit operations on contaminated
runways without engine failure accountability, or using a VSTOP and
a VGO instead of a single V1, these performance
assumptions may be retained. In this case, a simple method to derive a single
V1 and associated data consistent with the performance
assumptions of paragraph 6.2.1 must also be provided in the AFM.
NOTE: VSTOP
is the highest decision speed from which the aeroplane can stop within the
accelerate-stop distance available. VGO is the lowest decision
speed from which a continued take-off is possible within the take-off distance
available.
7.0 Effects
of Contaminant
7.1 Contaminant Drag — Standing Water,
Slush, Wet Snow
General
advice and acceptable calculation methods are given for estimating the drag
force due to fluid contaminants on runways:
Total drag Drag due to Drag due to
airframe
due to fluid = fluid displacement + impingement
of fluid
contaminant by tyres spray from
tyres
The essence
of these simple calculation methods is the provision of appropriate values of
drag coefficients below, at, and above tyre aquaplaning speed, VP (see
paragraph 7.1.1):
—
Paragraphs
7.1.2.a and 7.1.2.b give tyre displacement drag coefficient values for speeds
below VP.
—
Paragraph
7.1.3.b.2 gives tyre equivalent displacement drag coefficient values to
represent the skin friction component of impingement drag for speeds below VP.
—
Paragraph
7.1.4 gives the variation with speed, at and above VP, of drag
coefficients representing both fluid displacement and impingement.
The
applicant may account for the contaminant drag for computing the deceleration
segment of the accelerate-stop distance. However, if the actual contaminant
depth is less than the reported value, then, using the reported value to
determine the contaminant drag will result in a higher drag level than the
actual one. This will lead to a conservative take-off distance and take-off
run, but also to a potentially optimistic accelerate-stop distance. It is
assumed that these effects will offset each other; however, the applicant may
consider:
—
either
using 100 % of the reported contaminant depth when determining the
acceleration portion, and 50 % when considering the deceleration portion; or
—
using
50 % of the reported contaminant depth when determining both the acceleration
portion and the stop portion of the accelerate-stop distance; this should
result in a conservative computation without being unduly penalising; the
applicant should ensure that using drag for 50 % of the reported contaminant
depth for computing the accelerate-stop distance is conservative for the
applicant’s aeroplane configuration.
7.1.1 Aquaplaning Speed
An aeroplane
will aquaplane at high speed on a surface that is contaminated by standing
water, slush or wet snow. For the purposes of estimating the effect of
aquaplaning on contaminant drag, the aquaplaning speed, VP, is
given by -
VP = 9
where VP
is the ground speed in knots and P is the tyre pressure in lb/in2.
To estimate
the effect of aquaplaning on wheel-to-ground friction, the aquaplaning speed
(VP) that is provided above should be factored by a coefficient of
0.85.
Predictions
(Reference 5) indicate that the effect of running a wheel over a low‑density
liquid contaminant containing air, e.g. slush, is to compress it such that it
essentially acts as high-density contaminant. This means that there is
essentially no increase in aquaplaning speed to be expected with such a lower
density contaminant. For this reason, the aquaplaning speed given here is not
a function of the density of the contaminant.
(See
References 1, 5 and 10)
7.1.2 Displacement
Drag
This is drag
due to the wheel(s) running through the contaminant and doing work by
displacing the contaminant sideways and forwards.
a. Single wheel.
The drag on
the tyre is given by -
D = CD½rV2S
Where r is the density of the
contamination, S is the frontal area of the tyre in the contaminant and V is
the groundspeed, in consistent units.
S = b x d
where d is the depth of contamination and b is the effective tyre width at the
contaminant surface and may be found from –
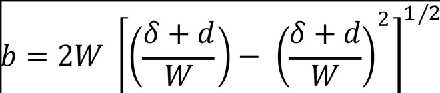
Where W is
the maximum width of the tyre and d is the tyre deflection, which may
be obtained from tyre manufacturers’ load-deflection curves.
The value of
CD may be taken as 0.75 for an isolated tyre below the aquaplaning speed, VP.
(See
Reference 3)
b. Multiple wheels
A typical
dual wheel undercarriage shows a drag 2.0 times the single wheel drag,
including interference. For a typical four-wheel bogie layout the drag is 4
times the single wheel drag (again including interference). For a six-wheel
bogie layout a reasonable conservative estimate suggests a figure of 4.2 times
the single wheel drag. The drag of spray striking the landing gear structure
above wheel height may also be important and should be included in the
analysis for paragraph 7.1.3.b.1 but for multiple wheel bogies the factors
above include centre spray impingement drag on gear structure below wheel
height.
(See
Reference 3)
7.1.3 Spray Impingement Drag
a. Determination of spray geometry
The sprays
produced by aeroplane tyres running in a liquid contaminant such as slush or
water are complex and depend on aeroplane speed, the shape and dimensions of
the loaded tyre and the contaminant depth. The spray envelope should be
defined, that is the height, width, shape and location of the sideways spray
plumes and, in the case of a dual wheel undercarriage, the centre spray
plumes. Additionally, a forward bow-wave spray will be present which may be
significant in drag terms should it impinge on the aeroplane.
In order to
assess the drag it is necessary to know the angles of the spray plumes so that
they can be compared with the geometry of the aeroplane. The angle at which the plumes rise is
generally between 10° and 20° but it varies considerably with speed and depth
of precipitation and to a small extent with tyre geometry. A method for estimating the plume angles in
the horizontal and vertical directions is given in References 1 and 7 and may
be used in the absence of experimental evidence. This information may be used to indicate
those parts of the airframe which will be struck by spray, in particular
whether the nose-wheel plume will strike the main landing gear or open
wheel-wells, the wing leading edges or the engine
nacelles, and whether the main-wheel plumes will strike the rear fuselage or
flaps.
b. Determination of the retarding forces
Following
definition of the spray envelopes, the areas of contact between the spray and
the airframe can be defined and hence the spray impingement drag determined.
This will be in two parts, direct interaction of the spray with the aeroplane
structure and skin friction.
For smaller
jet aeroplanes, typically those where the wing-to-ground height is less than 2
metres (6 feet), the methods contained in this document may not be
conservative. Drag estimates should be correlated with performance
measurements taken, for example, during water trough tests for engine ingestion.
b.1. Drag caused by direct impact of the spray
For
aeroplane designs where surface areas are exposed to direct spray impact, the
resulting drag forces should be taken into account. These forces exist where a
significant part of the spray flow is directed at part of the aeroplane
structure at a normal or non-oblique angle. The drag, or momentum loss of the
mass of fluid, so caused should be accounted for.
(See
Reference 6)
b.2. Drag caused by skin friction
Reference 2
explains that the relative velocity
between spray from the
landing gear and wetted aeroplane components causes drag due to skin friction
and provides a method for its calculation. Where more than one spray acts on
the same wing or fuselage surface the skin friction forces are not cumulative
and the single, higher calculated value should be used.
An
alternative, simple, conservative empirical estimate of skin friction drag,
which converts the skin friction drag into an equivalent displacement drag coefficient based on nose-wheel alone
drag measurements, is given by
CD
spray = 8 x L x 0.0025
where CD
spray is to be applied to the total nose-wheel displacement area (b x d x
number of wheels) and L is the wetted fuselage length in feet behind the point
at which the top of the spray plume reaches the height of the bottom of the
fuselage. This relation can also be used in the case of a main-wheel spray
striking the rear fuselage. In the case of any one main wheel unit only the
inner plume from the innermost leading wheel is involved so the relevant
displacement area is half that of one main wheel.
7.1.4 Effect of Speed on Displacement and
Impingement Drag Coefficients at and
above Aquaplaning Speed (VP)
The drag
above VP reduces to zero at lift off and one acceptable method is
to reduce CD as shown in the curve in Figure 1. This relationship
applies to both displacement and spray impingement drag coefficients.
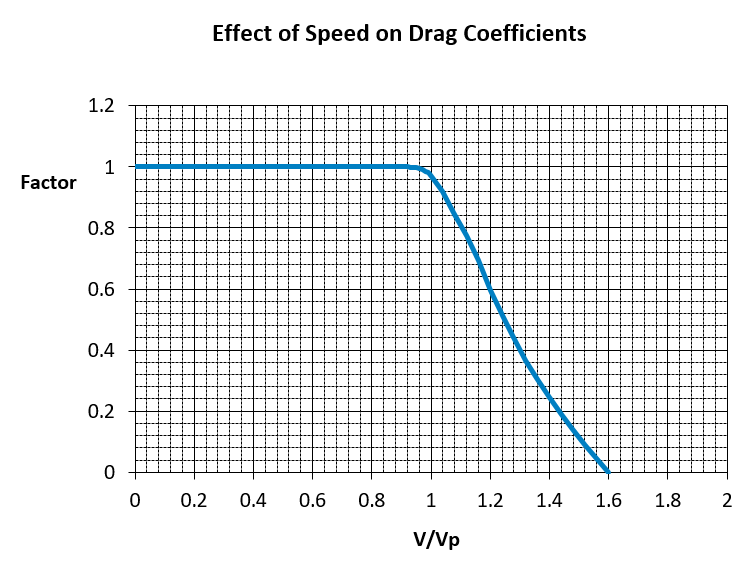
Figure
1
7.2 Contaminant
Drag - Dry Snow
A basic method for calculating the drag of
aeroplane tyres rolling in dry snow is given herein. The method is based on
the theoretical model presented in References 8 and 9, using a specific
gravity of 0.2 as provided in Table 1. Only snow of specific gravity of 0.2 is
selected because it represents naturally occurring snow and results in the
highest drag variation with ground speed for the range of snow specific
gravities that are likely to be encountered. For other snow specific
gravities, the more detailed methods of Reference 8 should be used.
7.2.1 Single Tyre Drag
The total
displacement drag of a tyre rolling in dry snow is presented by the following
equation:
D = DC
+ DD
The term DC
represents the drag due to the compression of the snow by the tyre. The term
DD represents the drag due to the displacement of the snow
particles in a vertical direction.
The drag due
to snow compression for a single tyre for snow with a specific gravity of 0.2
is given by:
Tyre
pressure > 100 psi
DC =
74000 bd (Newtons)
Tyre
pressure 50 £ p £ 100
psi
DC =
56000 bd (Newtons)
In which:
d = snow
depth in metres
b = is
the tyre width at the surface in metres (see paragraph 7.1.2)
The drag due
to the displacement of the snow particles in a vertical direction for a single
tyre for snow with a specific gravity of 0.2 is given by:
Tyre
pressure > 100 psi

Tyre
pressure 50 £ p £ 100
psi
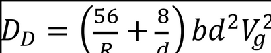
In which:
d = snow
depth in metres
b = is
the tyre width at the surface in metres (see paragraph 7.1.2)
Vg = the
ground speed in m/s
R = tyre
radius in metres
For other
snow densities DC and DD can be calculated using the
method presented in Reference 8.
7.2.2 Multiple Wheels
The drag on
dual tyre landing gears (found on both nose and main gears) is simply the drag
of both single tyres added together. The interference effects between both
tyres, found on dual tyre configurations running through slush or water, are
not likely to be present when rolling over a snow covered surface. The drag
originates from the vertical compaction of the snow layer. Although there is
some deformation perpendicular to the tyre direction of motion, this
deformation occurs mainly at or below the bottom of the rut and therefore does
not affect the deformation in front of the adjacent tyre. Hence, interference
effects can be ignored.
In the case
of a bogie landing gear only the leading tyres have to be considered for the
drag calculation, as explained in Reference 8. After the initial compression
of the snow by the leading tyres, the snow in the rut becomes stronger and a
higher pressure must be applied to compress the snow further. Therefore, the
drag on the trailing tyres can be neglected and the drag on a bogie landing
gear is assumed to be equal to that of a dual tyre configuration. All other
multiple-tyre configurations can be treated in the same manner.
7.2.3 Spray Impingement Drag
Experiments
have shown that the snow spray coming from the tyres is limited with only
small amounts striking the airframe. The speed and the density of the snow
spray are much lower than, for instance, that of water spray. Therefore, the
drag due to snow impingement on the airframe can be neglected.
7.2.4 Total Landing Gear Drag
To obtain
the total drag on the tyres due to snow, DC and DD for
each single tyre (excluding the trailing tyres of a bogie gear) should be
calculated and summed.
7.3 Braking Friction (All Contaminants)
On most
contaminant surfaces the braking action of the aeroplane will be impaired. Performance
data showing these effects can be based on either the minimum conservative
‘default’ values, given in Table 2 or test evidence and assumed values (see
paragraph 7.3.2). In addition the applicant may optionally provide performance
data as a function of aeroplane braking coefficient or wheel braking
coefficient.
7.3.1 Default Values
To enable
aeroplane performance to be calculated conservatively in the absence of any
direct test evidence, default wheel-braking
coefficient values as
defined in Table 2 may be used. These values represent the maximum effective wheel-braking coefficient of a fully
modulating anti-skid controlled braked wheel/tyre. For quasi modulating
systems, the applicant should multiply the listed wheel-braking coefficient by
0.625, and for on-off systems, multiply the listed wheel-braking coefficient
by 0.375. For the classification of anti-skid systems, the applicant should
refer to AMC 25.109(c)(2). Aeroplanes without anti-skid
systems should be addressed separately on a case-by-case basis.
|
Contaminant |
Default Wheel-Braking Coefficient m |
|
Standing water and slush |
where V is ground speed in knots Note:
For V greater than 85 % of the aquaplaning speed (VP),
use the = 0.05 constant. At the discretion of the applicant, the wheel‑braking
coefficient as defined for runway condition codes (RWYCC) 2 in AMC 25.1592 may be applied. |
|
Wet snow above 3 mm
depth |
0.16 |
|
Dry snow above 3 mm depth |
0.16 |
|
Wet snow over compacted snow |
0.16 |
|
Dry snow over compacted snow |
0.16 |
|
Compacted snow below outside air temperature (OAT)
of -15 °C |
0.20 |
|
Compacted snow above OAT of |
0.16 |
|
Ice |
0.07 |
|
Slippery wet |
0.16 |

Note: Braking Force = load on braked wheel x
Default Friction Value m
Table
2
Note: For a
specially prepared winter runway surface no default friction value can be
given due to the diversity of conditions that will apply.
(See
reference 10)
7.3.2 Other Than Default Values
In
developing aeroplane braking performance using either test evidence or assumed
friction values other than the default values provided in Table 2, a number of
other brake related aspects should be considered. Brake efficiency should be assumed to be
appropriate to the brake and anti-skid system behaviour on the contaminant
under consideration or a conservative assumption can be used. It can be assumed that wheel brake torque
capability and brake energy characteristics are unaffected. Where the tyre
wear state significantly affects the braking performance on the contaminated
surface, it should be assumed that there is 20% of the permitted wear range
remaining.
Where
limited test evidence is available for a model predecessor or derivative this
may be used given appropriate conservative assumptions.
7.3.3 Use of Ground Friction Measurement Devices
There is
not, at present, a correlation
between aircraft stopping capability and ground friction measuring devices. Hence, it
is not practicable at present to determine aeroplane performance on the basis
of a friction index measured by ground friction devices. Notwithstanding this
lack of correlation, the applicant may optionally
choose to present take-off performance data as a function of an aeroplane
braking coefficient or wheel braking coefficient constant with ground speed
for runways contaminated with compacted snow or ice. The responsibility for
relating this data to a friction index measured by a ground friction device
will fall on the operator and the competent authority of the
State of operator.
7.3.4 Specially prepared winter runway surfaces
At the
discretion of the applicant, take-off performance data may be provided for
specially prepared winter runway surfaces. This may include icy surfaces that
have been treated with sand or gravel in such a way that a significant
improvement of friction may be demonstrated. The applicant should apply a
reasonable margin to the observed braking action in performance computations
for such surfaces, and assume wheel-braking coefficients no greater than 0.20
for fully modulating anti‑skid systems. For other anti-skid system types, this
coefficient must be factored as described in Section 7.3.1. The competent
authority of the State of aerodrome should approve appropriate procedures and
methods in compliance with point ADR.OPS.B.036 of Annex IV (Part-ADR.OPS) of
Regulation (EU) No 139/2014 (‘Aerodromes Regulation’).
7.4 Additional Considerations
7.4.1 Minimum V1
For the
purpose of take-off distance determination, it has been accepted that the
minimum V1 speed may be established using the VMCG value
established in accordance with CS 25.149(g). As implied in paragraph 8.1.3, this may not ensure that the
lateral deviation after engine failure will not exceed 30 ft on a contaminated
runway.
7.4.2 Reverse Thrust
Performance
information may include credit for reverse thrust where available and
controllable, as described in AMC 25.109.
8.0 Presentation of Supplementary Performance
Information
8.1 General
Performance
information for contaminated runways, derived in accordance with the
provisions of paragraphs 5.0 to 7.0, should be accompanied by appropriate
statements such as:
8.1.1 Operation on runways contaminated with water,
slush, snow, ice or other contaminants implies uncertainties with regard to
runway friction and contaminant drag and therefore to the achievable
performance and control of the aeroplane during take-off, since the actual
conditions may not completely match the assumptions on which the performance
information is based. Where possible, every effort should be made to ensure
that the runway surface is cleared of any significant contamination.
8.1.2 The performance information assumes any
runway contaminant to be of uniform depth and density.
8.1.3 The provision of performance information for
contaminated runways should not be taken as implying that ground handling
characteristics on these surfaces will be as good as can be achieved on dry or
wet runways, in particular following engine failure, in crosswinds or when
using reverse thrust.
8.1.4 The contaminated runway performance
information does not in any way replace or amend the Operating Limitations and
Performance Information listed in the AFM, unless otherwise stated.
8.2 Procedures
In addition to performance information appropriate to operating on a contaminated runway, the AFM should also include recommended procedures associated with this performance information. Differences in other procedures for operation of the aeroplane on a contaminated surface should also be presented, e.g., reference to crosswinds or the use of high engine powers or derates.
8.3 Take-off Data
This should
be presented either as separate data appropriate to a defined runway
contaminant or as incremental data based on the AFM normal dry or wet runway
information.
The landing
distance must be presented either directly or with the factors required by the
operating manuals, with clear explanation where appropriate.
Where data
is provided for a range of contaminant depths, for example greater than 3, 6,
9, 12, 15 mm, then the AFM should clearly indicate how to define data for
contaminant depths within the range of contaminant depths provided.
The AFM
should provide:
—
the
performance data for operations on contaminated runways; and
—
definitions
of runway surface conditions.
The AFM
should state that operations are prohibited on runways with contaminant depths
greater than those for which data is provided. Instructions for the use of
that data should be provided in the appropriate documentation.
Where the AFM presents data using VSTOP and VGO,
it must be stated in the AFM that use of this concept is acceptable only where
operation under this standard is permitted.
9 References
Reference
sources containing worked methods for the processes outlined in 7.1 to 7.3.3
are identified below:
1. ESDU Data Item 83042, December 1983,
with Amendment A, May 1998, ‘Estimation of Spray Patterns Generated from the
Side of Aircraft Tyres Running in Water or Slush’.
2. ESDU Data Item 98001, May 1998, ‘Estimation
of Airframe Skin-Friction Drag due to Impingement of Tyre Spray’.
3. ESDU Data Item 90035*, November 1990,
with Amendment A, October 1992, ‘Frictional and Retarding Forces on Aircraft
Tyres, Part V: Estimation of Fluid Drag Forces’.
4. ESDU Memorandum No.97*, July 1998, ‘The
Order of Magnitude of Drag due to Forward Spray from Aircraft Tyres’.
5. ESDU Memorandum No. 96, reissue May 2011, ‘Operations on Surfaces Covered
with Slush’.
6. ESDU Memorandum No. 95, reissue October 2013,
‘Impact Forces Resulting From Wheel Generated Spray: Re-Assessment Of Existing
Data’.
7. NASA Report TP-2718 ‘Measurement of Flow
Rate and Trajectory of Aircraft Tire-Generated Water Spray’.
8. Van Es, G.W.H., ‘Method for Predicting
the Rolling Resistance of Aircraft Tires in Dry Snow’. AIAA Journal of
Aircraft, Volume 36, No.5, September-October 1999.
9. Van Es, G.W.H., ‘Rolling Resistance of
Aircraft Tires in Dry Snow’, National Aerospace Laboratory NLR, Technical
Report TR-98165, Amsterdam, 1998.
10. ESDU Data Item 72008*, May 1972, ‘Frictional
and retarding forces on aircraft tyres’, Part III: planning.
11. FAA AC 25-31, ‘Takeoff
Performance Data for Operations on Contaminated Runways’, dated 22 December 2015.
12. ICAO Document 10064, ‘Aeroplane
Performance Manual’, First Edition 2020.
* This document has been withdrawn by ESDU and is no longer available.
[Amdt 25/2]
[Amdt 25/27]