Appendix 4 – Allowable Probabilities
The following
probabilities may be used for environmental conditions and operational factors
(not caused by aeroplane failures) in quantitative safety analyses:
Environmental Factors
|
Condition |
Model or other Justification |
Probability |
|
CS-25 Appendix C icing
conditions |
1 |
|
|
CS-25 Appendix O icing conditions |
|
10-2 per flight hour |
|
Icing conditions beyond
certified conditions (considered as ‘Severe icing’) |
No accepted standard data |
|
|
Head wind >25 kt during takeoff and landing |
AC 120-28 CS-AWO |
10-2 per flight |
|
Tail wind >10 kt during takeoff and landing |
AC 120-28 CS-AWO |
10-2 per flight |
|
Cross wind >20 kt during takeoff and landing |
AC 120-28 CS-AWO |
10-2 per flight |
|
Limit design gust and turbulence |
CS 25.341 (Under
review by Structures Harmonisation Working Group) |
10-5 per flight hour |
|
Air temperature < -70°C |
No accepted standard data |
Aeroplane Configurations
|
Configuration |
Model or other Justification |
Probability |
|
Centre of gravity |
Standard industry practice |
Uniform over approved range |
|
Landing and Takeoff Weights/Masses |
Standard industry practice |
Uniform over approved range |
Flight Conditions
|
Condition |
Model or other Justification |
Probability |
|
Flight condition requiring Stall Warning |
Assumption |
10-2 per flight |
|
Flight condition resulting in a Stall |
Assumption |
10-5 per flight |
|
Excessiveness of VMO/MMO |
Assumption |
10-2 per flight |
|
Flight condition greater than or equal to 1.5 g |
No accepted standard data |
|
|
Flight condition less than or equal to 0 g |
No accepted standard data |
Mission Dependencies
|
Event |
Model or other Justification |
Probability |
|
Any rejected take-off |
No accepted standard data |
|
|
High energy rejected take-off |
No accepted standard data |
|
|
Need to jettison fuel |
No accepted standard data |
|
|
Go-around |
No accepted standard data |
Other Events
|
Event |
Model or other Justification |
Probability |
|
Fire in a lavatory not caused by aeroplane failures |
No accepted standard data |
|
|
Fire in a cargo compartment not caused by aeroplane failures |
No accepted standard data |
Notes:
1. If “No accepted standard data” appears
in the above tables, the applicant must provide a justified value if a
probability less than 1 is to be used in the analysis.
2. The probabilities quoted in this
Appendix have been found to be appropriate for use in the context of a
quantitative safety analysis performed to demonstrate compliance with CS 25.1309. They may not always be appropriate for use in the context of other
requirements.
[Amdt
25/24]
Appendix 5 – Example of limit latency and residual probability analysis
ED
Decision 2021/015/R
The following example illustrates how the quantitative criteria of CS 25.1309(b)(5) are to be implemented together with CS 25.1309(b)(1). The methodology used is based on the identification of the minimal cut sets associated with the catastrophic top event of the generic system level fault tree provided in Figure A5-1.
The term ‘minimal cut set’ refers to the smallest set of primary events whose occurrence is sufficient to cause a system failure or, in this case, the failure condition of concern.
(1) The list of minimal cut sets should be produced by cut set order. This will group all dual-order cut sets or failure combinations. The entire list of minimal cut sets of the fault tree in Figure A5-1 is provided in Table A5-1.
(2) The dual-order minimal cut sets that contain a primary event that is latent for more than one flight are then identified from the list in Table A5-1.
(3) Then group those dual-order minimal cut sets:
(3.1) that contain the same active primary event. For each group, sum the remaining latent failure probabilities. For each group, the sum of the latent primary events should be less than 1/1 000.
(3.2) that contain the same latent primary event. For each group, assume that the latent primary event has failed and sum the remaining active primary event probabilities. For each group, the sum of the primary event probabilities should be less than 1 × 10⁻⁵/FH.
(4) The sum of all minimal cut sets should be in the order of 1 × 10⁻⁹/FH.
An alternative method to perform step (3.2) would be to rerun the fault-tree-probability calculation assuming for each model rerun that a different latent primary event has occurred and then verify that the average probability per flight hour of the top event is of the order of 1 × 10⁻⁵/FH or less.
The results of the limit latency and residual probability analysis are provided in Table A5-1.
Exposure time in flight hours If no value, the failure is detected within one flight Primary event name Primary event probability
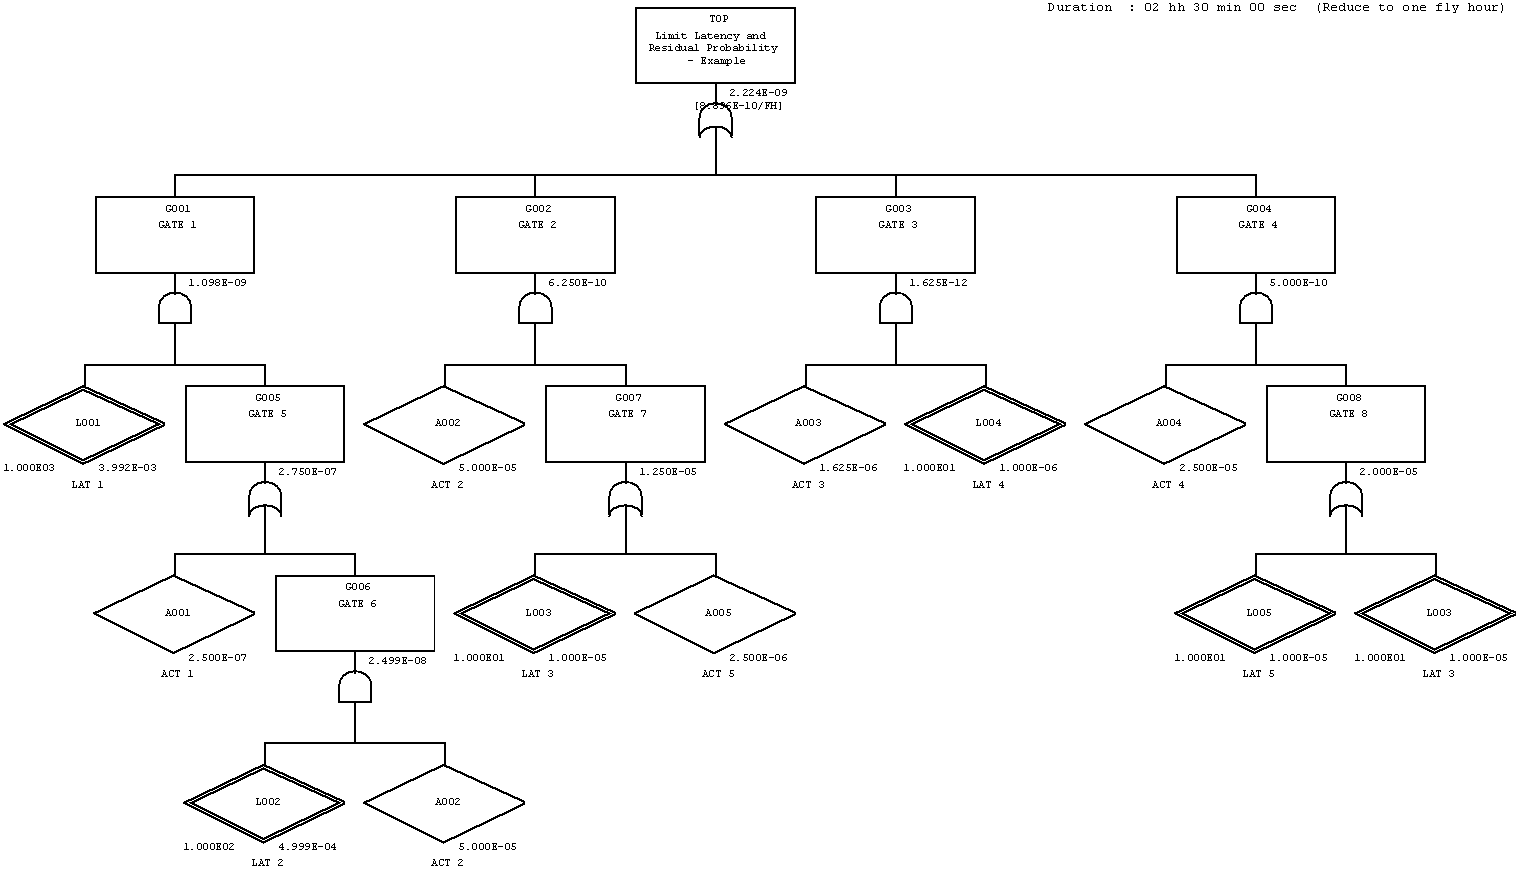
Figure A5-1: Fault Tree
|
# |
Probability (per
flight hour) |
Event name |
Event
description |
Failure rate
(constant, unless noted) |
Exposure time |
Event
probability (per flight) |
CS 25.1309(b)(5) Applicability/
compliance |
|
1 |
3.992E-10 |
A001 |
ACT 1 |
1.000E-07 |
2.5 h |
2.500E-07 |
Not compliant with the limit latency criterion [L001
probability is more frequent than 1.000E-03]. |
|
L001 |
LAT 1 |
4.000E-06 |
1 000.0 h |
3.992E-03 |
|||
|
2 |
2.000E-10 |
A002 |
ACT 2 |
2.000E-05 |
2.5 h |
5.000E-05 |
Not compliant with the residual probability criterion
[A002 probability per flight hour (2.000E-05/FH) is more frequent than
1.000E-05/FH]. |
|
L003 |
LAT 3 |
1.000E-06 |
10.0 h |
1.000E-05 |
|||
|
3 |
1.000E-10 |
A004 |
ACT 4 |
1.000E-05 |
2.5 h |
2.500E-05 |
Not compliant with the residual probability criterion
[while A004 probability per flight hour is equal to 1.000E-05/FH, the
combined probability per flight hour of A004 and A002 (1.000E-05/FH +
2.000E-05/FH) is more frequent than 1.000E-05/FH. Note:
Dual-order minimal cut sets #2 and #3 are grouped due to same event L003
appearing under G002 and G004. |
|
L003 |
LAT 3 |
1.000E-06 |
10.0 h |
1.000E-05 |
|||
|
4 |
1.000E-10 |
A004 |
ACT 4 |
1.000E-05 |
2.5 h |
2.500E-05 |
Compliant with both limit latency and residual
probability criteria |
|
L005 |
LAT 5 |
1.000E-06 |
10.0 h |
1.000E-05 |
|||
|
5 |
5.000E-11 |
A002 |
ACT 2 |
2.000E-05 |
2.5 h |
5.000E-05 |
This dual-order minimal cut set does not contain any
basic event being latent for more than one flight. |
|
A005 |
ACT 5 |
1.000E-06 |
2.5 h |
2.500E-06 |
|||
|
6 |
6.500E-13 |
A003 |
ACT 3 |
6.500E-07 |
2.5 h |
1.625E-06 |
Compliant with both limit latency and residual
probability criteria |
|
L004 |
LAT 4 |
1.000E-07 |
10.0 h |
1.000E-06 |
|||
|
7 |
3.991E-11 |
A002 |
ACT 2 |
2.000E-05 |
2.5 h |
5.000E-05 |
This
minimal cut set is more than a dual failure combination. |
|
L001 |
LAT 1 |
4.000E-06 |
1 000.0 h |
3.992E-03 |
|||
|
L002 |
LAT 2 |
5.000E-06 |
100.0 h |
4.999E-04 |
|||
|
Flight time = 2.5 hours P[LAT i] ~ FR * T |
|||||||
Table A5-1: Minimal Cut Sets
[Amdt 25/24]
[Amdt 25/27]