GM7 Safety
performance indicator (SPI) for monitoring ATFM over-deliveries
Regulation (EU) 2019/317
A. Definition
The purpose
of this guidance is to explain the ATFM OVD SPI, its calculation and how it
will be monitored.
The OVD SPI
is defined in Annex I, Section 3, point 2.2 as:
‘The ATFM
over-deliveries above the capacity limits of a sector declared by the air
navigation service provider where ATFM regulations are imposed, calculated as
follows:
(a) the ratio between
the time that the number of flights exceeds by more than 10% the capacity
limits of a sector declared by the air navigation service provider where ATFM
regulations are imposed, and the total time where ATFM regulations are
imposed, calculated for the whole calendar year and for each year of the
reference period;
(b) for the purposes of
this indicator, the regulated time is divided in overlapping hourly slices at
every 20-minutes interval.’
An ATFM
regulation is a traffic flow measure that aims to protect a node that
may potentially be overloaded by limiting the maximum rate of aircraft
entering the node. The ATFM regulation is requested by affected ANSPs whenever
expected demand exceeds available capacity of the node and will affect a number
of flights that enter the node in a time period. Flights entering a regulated
sector during the regulation period are subject to that regulation and may be
assigned ATFM slots by the Network Manager. An ATFM regulation is, therefore,
characterised by a regulated time duration, by the acceptable rate of flights
that enter the regulated sector, and the flights affected, also known as traffic volume (TV).
The traffic
volume is created based on either a sector in the airspace, in which case
falls within the scope of the indicator definition, or a significant point in
the airspace or an airport/group of airports, which falls/fall outside the
scope.
In order to
determine the total regulated time for an ATFM regulation applied on a traffic
volume, the method considers the interval between the regulation start time
and regulation end. The regulation end is defined as:
1. either the last regulation end time
indicated when a regulation is created and at subsequent extensions, if any,
when the regulation is not cancelled;
2. or the time at which the regulation was
cancelled, when this happens before the declared regulation end time.
The
regulated time is further divided in ‘overlapping hourly slices at every
20-minute intervals’.
For example,
a regulation starting at 10:40 and ending at 11:40 will have 7 overlapping
hourly slices defined as illustrated in Figure 2:

Figure 2: Example of hourly slices of 20-minute intervals of a regulated sector
The last
slice is the first hourly slice reaching the regulation end; in the example
above it is the 12:40 to 13:30 (this is the only slice that can be less than 1
hour).
B. Example of the OVD calculation indicator
Figure 3 is
an example of an ATFM regulation that was imposed over a certain sector with a
regulated rate of 35 flights/hour. The ATFM regulation duration applied
from 10:40 until 13:30. The orange bars in the graph depict 20-minute slices
that were over-delivered, while the green bars depict 20-minute slices where
the actual flight entries were below the regulated rate. In this example, the
OVD indicator value is OVD = 3/7 = 42.9 %.
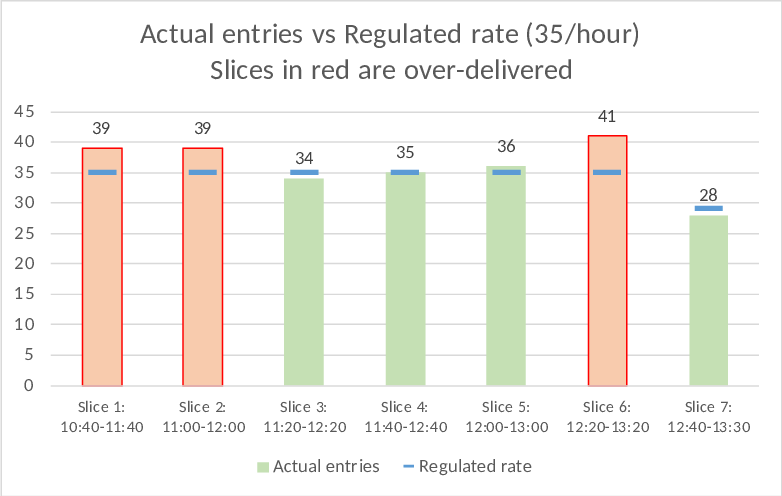
Figure 3: Example of over-deliveries in 20-minute intervals in a regulated sector
The number of actual flight entries in the TV for each 20-minute slice is calculated from the current tactical flight model (CTFM) profile generated by the NM system (whenever a flight fulfils that the CTFM entry time ≥ slice start time and the CTFM entry time < slice end time). To this, a correction will be applied for the airspace un-anticipated flights[40] that, although geographically are crossing the regulated sector, from an operational perspective are not under the control of that sector (non-operational un-anticipated traffic). The objective is to avoid ‘false positives’, i.e. situations when an over-delivery seems to have occurred while in reality there was none . This categorisation will be implemented in the NM reporting system during RP3.
The technical system of the NM generates and archives the data used for OVD monitoring:
1. regulated TVs and associated reference locations;
2. ATFM regulation start, end, and cancellation times;
3. regulated rates;
4. number of actual entries in the regulated TVs for each slice; the categorisation of non-operational un-anticipated traffic will be available during RP3.
C. Level of aggregation of the OVD indicator
The OVD indicator can be determined for any combination of geographical areas (TV, ACC, SES area, NM area) or time intervals (daily, monthly, yearly). To aggregate the OVD indicator for the combination of geographical area and time interval, the total number of slices with over-delivery are divided by the total number of slices for the regulations within the reporting scope.
[40] Airspace un-anticipated traffic are flights that are not planned to enter the TV based on the last filed flight plan but that are actually entering the TV by deviating from flight plan.