Light
Dark
System
Log In
Loading...
Compare / EASA/
Incorporated Amendments
/
Compare & Highlight Differences
B11 Control surface loads
Available versions for ERULES-1963177438-8043
ED Decision 2003/18/RM
found in: CS-VLA Amdt 1 - Very Light Aeroplanes (Mar 2009)
Version
CS-VLA Amdt 1 - Ve... (Mar 2009)
Section
Share
Version
Show details
Hide details
Version
B11 Control surface loads ED Decision 2003/18/RM Acceptable values of limit average manoeuvring control-surface loadings may be obtained from figure B1 of this Appendix in accordance with the following: (a) For horizontal tail surfaces - (1) With the conditions in [CS-VLA 423(a)(i)](#_DxCrossRefBm584936707), obtain  as a function of W/S and surface deflection, using - (i) Curve C of figure B1 for a deflection of 10 o or less; (ii) Curve B of figure B1 for a deflection of 20 o; (iii) Curve A for a deflection of 30 o or more; (iv) Interpolation for all other deflections; and (v) The distribution of figure B7; and (2) With the conditions in [CS-VLA 423(a)(2)](#_DxCrossRefBm584936707), obtain  from curve B of figure B1 using the distribution of figure B7. (b) For vertical tail surfaces - (1) With the conditions in [CS-VLA 441(a)(1)](#_DxCrossRefBm584936689), obtain  as a function of W/S and surface deflection using the same requirements as used in sub-paragraphs (a) (1)(i) to (a)(1)(v) of this paragraph; (2) With the conditions in [CS-VLA 441(a)(2)](#_DxCrossRefBm584936689), obtain  from Curve C, using the distribution of figure B6; and (3) With the conditions in [CS-VLA 441(a)(3)](#_DxCrossRefBm584936689), obtain  from Curve A, using the distribution of figure B8. (c) For ailerons, obtain w from Curve B, acting in both the up and down directions, using the distribution of figure B9. 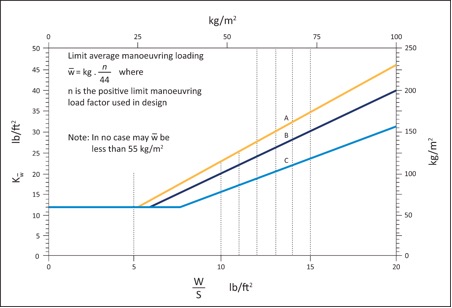 FIGURE B1 – LIMIT AVERAGE MANOEUVRING CONTROL SURFACE LOADING. 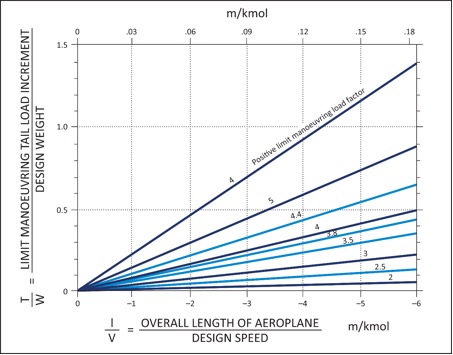 FIGURE B2 – MANOEUVRING TAIL LOAD INCREMENT (UP OR DOWN) As an alternative to Figure B2, the following may be used: 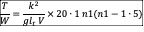 where: k is the radius of gyration of the aircraft in pitch lt is the distance between the aeroplane centre of gravity and the centre of the lift of the horizontal tail V is the aircraft speed in m/s. 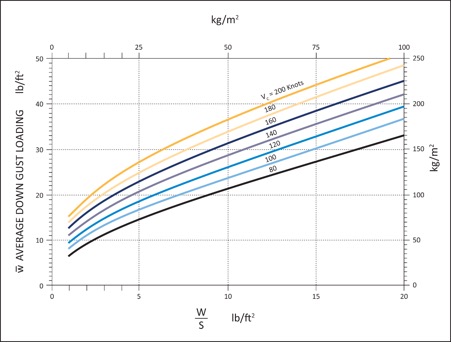 FIGURE B3 UP AND DOWN GUST LOADING ON HORIZONTALTAIL SURFACE. FIGURE B4 RESERVED. 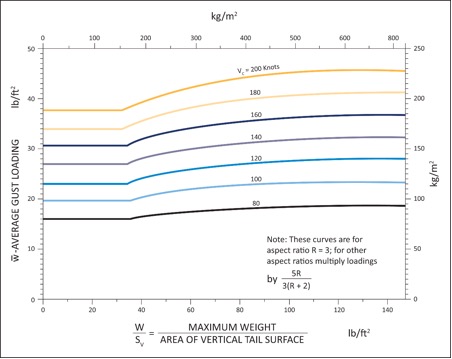 FIGURE B5 - GUST LOADING ON VERTICAL TAL SURFACE. 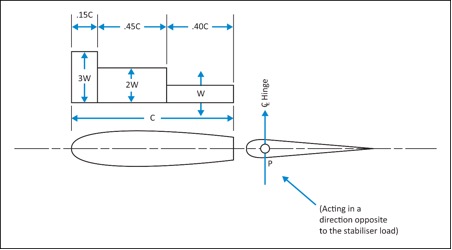 FIGURE B6 -TAIL SURFACE LOAD DISTRIBUTION. NOTES: (a) In balancing conditions in [CS-VLA 421](#_DxCrossRefBm584936705), P = 40% of net balancing load (flaps retracted); and P = 0 (flaps deflected). (b) In the condition in [CS-VLA 441(a)(2)](#_DxCrossRefBm584936689), P = 20% of net tail load. (c) The load on the fixed surface must be - (1) 140% of the net balancing load for the flaps retracted case of note (a); (2) 100% of the net balancing load for the flaps deflected case of note (a); and (3) 120% of the net balancing load for the case in note (b). 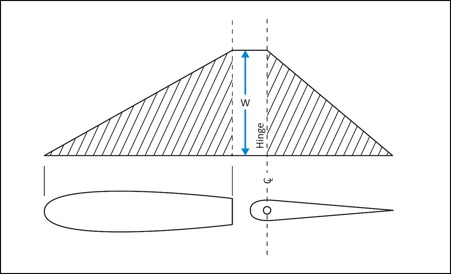 FIGURE B7 TAIL SURFACE LOAD DISTRIBUTION. 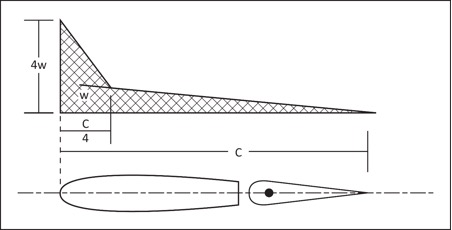 FIGURE B8 TAIL SURFACE LOAD DISTRIBUTION. 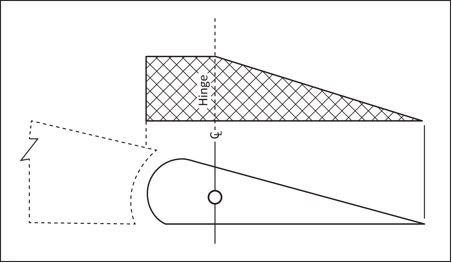 FIGURE B9 AILERON LOAD DISTRIBUTION.