Light
Dark
System
Log In
Loading...
Compare / EASA/
Incorporated Amendments
/
Compare & Highlight Differences
Appendix A Certification Standard Atmospheric Concentrations of Rain and Hail
Available versions for ERULES-1963177438-7398
ED Decision 2003/9/RM
found in: CS-E Amdt 5 - Engines (Dec 2018)
Version
...18)
Text
Removed: 0
Added: 0
Unchanged: 0
Share
Appendix A Certification Standard Atmospheric Concentrations of Rain and Hail ED Decision 2003/9/RM Figure A1, Table A1, Table A2, Table A3 and Table A4 in this Appendix A specify the atmospheric concentrations and size distributions of rain and hail for establishing certification, in accordance with the specifications of [CS-E 790(a)(2)](#_DxCrossRefBm1371447599). In conducting tests, normally by spraying liquid water to simulate rain conditions and by delivering hailstones fabricated from ice to simulate hail conditions, the use of water droplets and hailstones having shapes, sizes and distributions of sizes other than those defined in this Appendix A, or the use of a single size or shape for each water droplet or hailstone, can be accepted, provided the substitution does not reduce the severity of the test. [*Source of data in Tables A1 to A4: Results of the Aerospace Industries Association Propulsion Committee Study, Project PC 338–1, June 1990*]. Note: The unit for altitude has been kept as “feet” to be consistent with the source of data. This is compatible with Annex 5 of ICAO. FIGURE A1 - Illustration of Rain and Hail Threats. Certification concentrations are obtained using Tables A1 and A2. 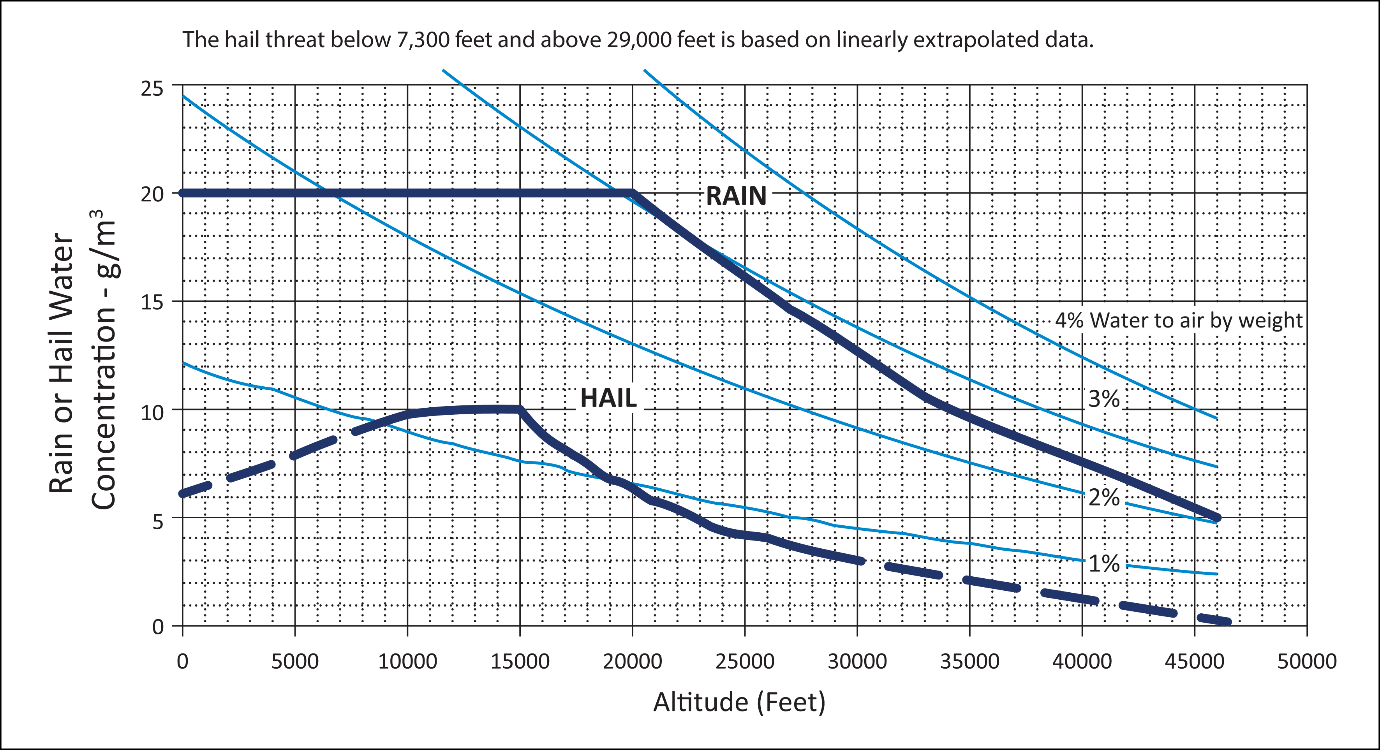 TABLE A1 – CERTIFICATION STANDARD ATMOSPHERIC RAIN CONCENTRATIONS <table border="1" cellpadding="0" cellspacing="0"><tr><td valign="top" width="253"><p>Altitude (feet)</p></td><td valign="top" width="345"><p>Rain Water Content (RWC) (grams water/cubic metre air)</p></td></tr><tr><td valign="top" width="253"><p>0</p></td><td valign="top" width="345"><p>20.0</p></td></tr><tr><td valign="top" width="253"><p>20 000</p></td><td valign="top" width="345"><p>20.0</p></td></tr><tr><td valign="top" width="253"><p>26 300</p></td><td valign="top" width="345"><p>15.2</p></td></tr><tr><td valign="top" width="253"><p>32 700</p></td><td valign="top" width="345"><p>10.8</p></td></tr><tr><td valign="top" width="253"><p>39 300</p></td><td valign="top" width="345"><p>7.7</p></td></tr><tr><td valign="top" width="253"><p>46 000</p></td><td valign="top" width="345"><p>5.3</p></td></tr></table> RWC values at other altitudes may be determined by linear interpolation. TABLE A2 – CERTIFICATION STANDARD ATMOSPHERIC HAIL CONCENTRATIONS <table border="1" cellpadding="0" cellspacing="0"><tr><td valign="top" width="253"><p>Altitude (feet)</p></td><td valign="top" width="345"><p>Hail Water Content (HWC) (grams water/cubic metre air)</p></td></tr><tr><td valign="top" width="253"><p>0</p></td><td valign="top" width="345"><p>6.0</p></td></tr><tr><td valign="top" width="253"><p>7 300</p></td><td valign="top" width="345"><p>8.9</p></td></tr><tr><td valign="top" width="253"><p>8 500</p></td><td valign="top" width="345"><p>9.4</p></td></tr><tr><td valign="top" width="253"><p>10 000</p></td><td valign="top" width="345"><p>9.9</p></td></tr><tr><td valign="top" width="253"><p>12 000</p></td><td valign="top" width="345"><p>10.0</p></td></tr><tr><td valign="top" width="253"><p>15 000</p></td><td valign="top" width="345"><p>10.0</p></td></tr><tr><td valign="top" width="253"><p>16 000</p></td><td valign="top" width="345"><p>8.9</p></td></tr><tr><td valign="top" width="253"><p>17 700</p></td><td valign="top" width="345"><p>7.8</p></td></tr><tr><td valign="top" width="253"><p>19 300</p></td><td valign="top" width="345"><p>6.6</p></td></tr><tr><td valign="top" width="253"><p>21 500</p></td><td valign="top" width="345"><p>5.6</p></td></tr><tr><td valign="top" width="253"><p>24 300</p></td><td valign="top" width="345"><p>4.4</p></td></tr><tr><td valign="top" width="253"><p>29 000</p></td><td valign="top" width="345"><p>3.3</p></td></tr><tr><td valign="top" width="253"><p>46 000</p></td><td valign="top" width="345"><p>0.2</p></td></tr></table> HWC values at other altitudes may be determined by linear interpolation. The hail threat below 7 300 feet and above 29 000 feet is based on linearly extrapolated data. TABLE A3 – CERTIFICATION STANDARD ATMOSPHERIC RAIN DROPLET SIZE DISTRIBUTION <table border="1" cellpadding="0" cellspacing="0"><tr><td valign="top" width="299"><p><b>Rain Droplet Diameter (mm)</b></p></td><td valign="top" width="299"><p><b>Contribution to total RWC (%)</b></p></td></tr><tr><td valign="top" width="299"><p>0 – 0.49 0 </p></td><td valign="top" width="299"><p>0</p></td></tr><tr><td valign="top" width="299"><p>0.50 – 0.99</p></td><td valign="top" width="299"><p>2.25 </p></td></tr><tr><td valign="top" width="299"><p>1.00 – 1.49</p></td><td valign="top" width="299"><p>8.75 </p></td></tr><tr><td valign="top" width="299"><p>1.50 – 1.99</p></td><td valign="top" width="299"><p>16.25 </p></td></tr><tr><td valign="top" width="299"><p>2.00 – 2.49</p></td><td valign="top" width="299"><p>19.00 </p></td></tr><tr><td valign="top" width="299"><p>2.50 – 2.99</p></td><td valign="top" width="299"><p>17.75 </p></td></tr><tr><td valign="top" width="299"><p>3.00 – 3.49</p></td><td valign="top" width="299"><p>13.50 </p></td></tr><tr><td valign="top" width="299"><p>3.50 – 3.99</p></td><td valign="top" width="299"><p>9.50 </p></td></tr><tr><td valign="top" width="299"><p>4.00 – 4.49</p></td><td valign="top" width="299"><p>6.00 </p></td></tr><tr><td valign="top" width="299"><p>4.50 – 4.99</p></td><td valign="top" width="299"><p>3.00 </p></td></tr><tr><td valign="top" width="299"><p>5.00 – 5.49</p></td><td valign="top" width="299"><p>2.00 </p></td></tr><tr><td valign="top" width="299"><p>5.50 – 5.99</p></td><td valign="top" width="299"><p>1.25 </p></td></tr><tr><td valign="top" width="299"><p>6.00 – 6.49</p></td><td valign="top" width="299"><p>0.50 </p></td></tr><tr><td valign="top" width="299"><p>6.50 – 7.00</p></td><td valign="top" width="299"><p>0.25 </p></td></tr><tr><td valign="top" width="299"></td><td valign="top" width="299"><p> TOTAL 100.00</p></td></tr></table> Median diameter of rain droplets is 2.66 mm. TABLE A4 – CERTIFICATION STANDARD ATMOSPHERIC HAILSTONE SIZE DISTRIBUTION <table border="1" cellpadding="0" cellspacing="0"><thead><tr><td valign="top" width="300"><p><b>Hailstone Diameter (mm)</b></p></td><td valign="top" width="300"><p><b>Contribution to total HWC (%)</b></p></td></tr></thead><tr><td valign="top" width="300"><p>0 – 4.9</p></td><td valign="top" width="300"><p>0 </p></td></tr><tr><td valign="top" width="300"><p>5.0 – 9.9</p></td><td valign="top" width="300"><p>17.00 </p></td></tr><tr><td valign="top" width="300"><p>10.0 – 14.9</p></td><td valign="top" width="300"><p>25.00 </p></td></tr><tr><td valign="top" width="300"><p>15.0 – 19.9</p></td><td valign="top" width="300"><p>22.50 </p></td></tr><tr><td valign="top" width="300"><p>20.0 – 24.9</p></td><td valign="top" width="300"><p>16.00 </p></td></tr><tr><td valign="top" width="300"><p>25.0 – 29.9</p></td><td valign="top" width="300"><p>9.75 </p></td></tr><tr><td valign="top" width="300"><p>30.0 – 34.9</p></td><td valign="top" width="300"><p>4.75 </p></td></tr><tr><td valign="top" width="300"><p>35.0 – 39.9</p></td><td valign="top" width="300"><p>2.50 </p></td></tr><tr><td valign="top" width="300"><p>40.0 – 44.9</p></td><td valign="top" width="300"><p>1.50 </p></td></tr><tr><td valign="top" width="300"><p>45.0 – 49.9</p></td><td valign="top" width="300"><p>0.75 </p></td></tr><tr><td valign="top" width="300"><p>50.0 – 55.0</p></td><td valign="top" width="300"><p>0.25 </p></td></tr><tr><td valign="top" width="300"></td><td valign="top" width="300"><p> TOTAL 100.00</p></td></tr></table> Median diameter of hailstones is 16 mm