Light
Dark
System
Log In
Loading...
Compare / EASA/
Incorporated Amendments
/
Compare & Highlight Differences
Appendix 1 to AMC 20-128A User's Manual
Available versions for ERULES-1963177438-6769
ED Decision 2003/12/RM
found in: AMC-20 Amdt 22 - Airworthiness of Products, Parts and Appliances (May 2021)
From
AMC-20 Amdt 23 - A... (Jan 2022)
AMC-20 Amdt 22 - A... (May 2021)
AMC-20 Amdt 21 - A... (Apr 2021)
From section
To
AMC-20 Amdt 23 - A... (Jan 2022)
AMC-20 Amdt 22 - A... (May 2021)
AMC-20 Amdt 21 - A... (Apr 2021)
To section
No visible text changes
0 removals
0 additions
View
Rich
Plain
Sync scrolling
Share
From
Show details
Hide details
To
Show details
Hide details
Version
Show side by side
Appendix 1 to AMC 20-128A User’s Manual ED Decision 2003/12/RM RISK ANALYSIS METHODOLOGY for UNCONTAINED ENGINE/APU FAILURE INDEX 1.0 GENERAL 2.0 SCOPE 3.0 FUNDAMENTAL COMPONENTS OF A SAFETY AND RISK ANALYSIS 4.0 ASSUMPTIONS 5.0 PLOTTING 6.0 METHODOLOGY – PROBABILITY ASSESSMENT 7.0 RESULTS ASSESSMENT <table border="0" cellpadding="0" cellspacing="0" width="591"><tr><td valign="top" width="72"><p>FIGURE 1</p></td><td valign="top" width="519"><p>EXAMPLE – HAZARD TREE</p></td></tr><tr><td valign="top" width="72"><p>FIGURE 2</p></td><td valign="top" width="519"><p>EXAMPLE – SYSTEM LOADING MATRIX</p></td></tr><tr><td valign="top" width="72"><p>FIGURE 3</p></td><td valign="top" width="519"><p>TRI-SECTOR ROTOR BURST</p></td></tr><tr><td valign="top" width="72"><p>FIGURE 4</p></td><td valign="top" width="519"><p>TYPICAL LAYOUT OF SYSTEMS IN ROTOR PLANE</p></td></tr><tr><td valign="top" width="72"><p>FIGURE 5</p></td><td valign="top" width="519"><p>TRAJECTORY RANGE PLOTTING</p></td></tr><tr><td valign="top" width="72"><p>FIGURE 6</p></td><td valign="top" width="519"><p>TYPICAL TRAJECTORY PLOTTING</p></td></tr><tr><td valign="top" width="72"><p>FIGURE 7</p></td><td valign="top" width="519"><p>DEFINITION – THREAT WINDOW</p></td></tr><tr><td valign="top" width="72"><p>FIGURE 8</p></td><td valign="top" width="519"><p>SAMPLE ROTOR STAGE PLOTTING CHART</p></td></tr></table> 1.0 GENERAL 1.1 The design of aeroplane and engine systems and the location of the engines relative to critical systems and structure have a significant impact on survivability of the aeroplane following an uncontained engine failure. CS 23.903(b)(1) and 25.903(d)(1) of the EASA Certification Specifications (CS) require that design precautions be taken to minimise the hazard to the aeroplane due to uncontained failures of engine or auxiliary power unit (APU). [AMC 20-128A](#_DxCrossRefBm1701658079) provides guidance for demonstrating compliance with these requirements. 1.2 As a part of this compliance demonstration, it is necessary to quantitatively assess the risk of a catastrophic failure in the event of an uncontained engine failure. This User’s Manual describes an acceptable method for this purpose. 1.3 The objective of the risk analysis is to measure the remaining risk after prudent and practical design considerations have been taken. Since each aeroplane would have unique features which must be considered when applying the methods described in this manual, there should be some flexibility in the methods and procedures. 1.4 It is a preferred approach to use these methods throughout the development of an aeroplane design to identify problem areas at an early stage when appropriate design changes are least disruptive. It is also advisable to involve the European Aviation Safety Agency (EASA) in this process at an early stage when appropriate interpretation of the methodology and documentation requirements can be established. 1.5 It should be noted that although the risk analysis produces quantitative results, subjective assessments are inherent in the methods of the analysis regarding the criticality of specific types of aeroplane component failures. Assumptions for such assessments should be documented along with the numerical results. 1.6 Aeroplane manufacturers have each developed their own method of assessing the effects of rotor failure, as there are many ways to get to the same result. This User’s Manual identifies all the elements that should be contained in an analysis, so that it can be interpreted by a person not familiar with such a process. 1.7 The intent of this manual therefore is to aid in establishing how an analysis is prepared, without precluding any technological advances or existing proprietary processes. 1.8 AMC 20-128A makes allowance for the broad configuration of the aeroplane as such damage to the structure due to rotor failure generally allows for little flexibility in design. System lay-out within a rotor burst zone, however, can be optimized. 1.9 Damage to structure, which may involve stress analysis, generally can be analyzed separately, and later coordinated with simultaneous system effects. 1.10 For an analysis of the effects on systems due to a rotor failure the aeroplane must be evaluated as a whole; and a risk analysis must specifically highlight all critical cases identified which have any potential to result in a catastrophe. 1.11 Such an analysis can then be used to establish that reasonable precautions have been taken to minimise the hazards, and that the remaining hazards are an acceptable risk. 1.12 A safety and a risk analysis are interdependent, as the risk analysis must be based on the safety analysis. The safety analysis therefore is the starting point that identifies potential hazardous or catastrophic effects from a rotor failure and is the basic tool to minimise the hazard in accordance with the guidelines of [AMC 20-128A](#_DxCrossRefBm1701658079). 1.13 The risk analysis subsequently assesses and quantifies the residual risk to the aeroplane. 2.0 SCOPE The following describes the scope of analyses required to assess the aeroplane risk levels against the criteria set forth in Paragraph 10 of [AMC 20-128A](#_DxCrossRefBm1701658079). 2.1 Safety Analysis is required to identify the critical hazards that may be numerically analyzed (hazards remaining after all practical design precautions have been taken). Functional criticality will vary by aeroplane and may vary by flight phase. Thorough understanding of each aeroplane structure and system functions is required to establish the criticality relative to each fragment trajectory path of the theoretical failure. Assistance from experts within each discipline is typically required to assure accuracy of the analysis in such areas as effects of fuel tank penetration on leakage paths and ignition hazards, thrust level control (for loss of thrust assessment), structural capabilities (for fuselage impact assessment), aeroplane controllability (for control cables impact assessment), and fuel asymmetry. 2.2 Risk For each remaining critical hazard, the following assessments may be prepared using the engine/APU failure models as defined in Paragraph 9 of [AMC 20-128A](#_DxCrossRefBm1701658079): a. Flight mean risk for single 1/3 disc fragment. b. Flight mean risk for single intermediate fragment. c. Flight mean risk for alternate model (when used as an alternate to the 1/3 disc fragment and intermediate fragment). d. Multiple 1/3 disc fragments for duplicated or multiplicated systems. e. Specific risk for single 1/3 disc fragment and single intermediate fragment. f. Specific risk for any single disc fragment that may result in catastrophic structural damage. The risk level criteria for each failure model are defined in Paragraph 10 of [AMC 20-128A](#_DxCrossRefBm1701658079). 3.0 FUNDAMENTAL COMPONENTS OF A SAFETY AND RISK ANALYSIS 3.1 The logical steps for a complete analysis are: a. Establish at the design definition the functional hazards that can arise from the combined or concurrent failures of individual systems, including multiplicated systems and critical structure. b. Establish a Functional Hazard Tree (see Figure 1), or a System Matrix (see Figure 2) that identifies all system interdependencies and failure combinations that must be avoided (if possible) when locating equipment in the rotor burst impact area. In theory, if this is carried out to the maximum, no critical system hazards other than opposite engine or fuel line hits would exist. c. Establish the fragment trajectories and trajectory ranges both for translational and spread risk angles for each damage. Plot these on a chart or graph, and identify the trajectory ranges that could result in hazardous combinations (threats) as per the above system matrix or functional hazard analysis. d. Apply risk factors, such as phase of flight or other, to these threats, and calculate the risk for each threat for each rotor stage. e. Tabulate, summarize and average all cases. 3.2 In accordance with [AMC 20-128A](#_DxCrossRefBm1701658079) the risk to the aeroplane due to uncontained rotor failure is assessed to the effects, once such a failure has occurred. The probability of occurrence of rotor failure, as analyzed with the probability methods of AMC 25.1309 (i.e. probability as a function of critical uncontained rotor failure rate and exposure time), does not apply. 3.3 The total risk level to the aeroplane, as identified by the risk analysis, is the mean value obtained by averaging the values of all rotor stages of all engines of the aeroplane, expressed as Flight Mean Risk. 4.0 ASSUMPTIONS 4.1 The following conservative assumptions, in addition to those in Paragraphs 10(a)(1), (2) and (3) of [AMC 20-128A](#_DxCrossRefBm1701658079), have been made in some previous analyses. However, each aeroplane design may have unique characteristics and therefore a unique basis for the safety assessment leading to the possibility of different assumptions. All assumptions should be substantiated within the analysis: a. The 1/3 disc fragment as modeled in Paragraph 9(a) of the [AMC 20-128A](#_DxCrossRefBm1701658079) travels along a trajectory path that is tangential to the sector centroid locus, in the direction of rotor rotation (Refer to Figure 3). The sector fragment rotates about its centroid without tumbling and sweeps a path equal to twice the greatest radius that can be struck from the sector centroid that intersects its periphery. The fragment is considered to possess infinite energy, and therefore to be capable of severing lines, wiring, cables and unprotected structure in its path, and to be undeflected from its original trajectory unless deflection shields are fitted. However, protective shielding or an engine being impacted may be assumed to have sufficient mass to stop even the most energetic fragment. b. The probability of release of debris within the maximum spread angle is uniformly distributed over all directions. c. The effects of severed electrical wiring are dependent on the configuration of the affected system. In general, severed wiring is assumed to not receive inadvertent positive voltage for any significant duration. d. Control cables that are struck by a fragment disconnect. e. Hydraulically actuated, cable driven control surfaces, which do not have designated “fail to” settings, tend to fail to null when control cables are severed. Subsequent surface float is progressive and predictable. f. Systems components are considered unserviceable if their envelope has been touched. In case of an engine being impacted, the nacelle structure may be regarded as engine envelope, unless damage is not likely to be hazardous. g. Uncontained events involving in-flight penetration of fuel tanks will not result in fuel tank explosion. h. Unpowered flight and off-airport landings, including ditching, may be assumed to be not catastrophic to the extent validated by accident statistics or other accepted factors. i. Damage to structure essential for completion of flight is catastrophic (Ref. [AMC 20-128A](#_DxCrossRefBm1701658079), Paragraph 10.b(1)). j. The flight begins when engine power is advanced for takeoff and ends after landing when turning off the runway. 5.0 PLOTTING 5.1 Cross-section and plan view layouts of the aeroplane systems in the ranges of the rotor burst impact areas should be prepared, either as drawings, or as computer models These layouts should plot the precise location of the critical system components, including fuel and hydraulic lines, flight control cables, electric wiring harnesses and junction boxes, pneumatic and environmental system ducting, fire extinguishing; critical structure, etc. 5.2 For every rotor stage a plane is developed. Each of these planes contains a view of all the system components respective outer envelopes, which is then used to generate a cross-section. See Figure 4. 5.3 Models or drawings representing the various engine rotor stages and their fore and aft deviation are then generated. 5.4 The various trajectory paths generated for each engine rotor stage are then superimposed on the cross-section layouts of the station planes that are in the range of that potential rotor burst in order to study the effects (see Figure 5). Thus separate plots are generated for each engine rotor stage or rotor group. To reduce the amount of an analysis the engine rotor stages may also be considered as groups, as applicable for the engine type, using the largest rotor stage diameter of the group. 5.5 These trajectory paths may be generated as follows and as shown in Figure 6: a. Two tangent lines T1 are drawn between the locus of the centroid and the target envelope. b. At the tangent line touch points, lines N1 and N2 normal to the tangent lines, are drawn with the length equal to the radius of the fragment swept path (as also shown in Figure 1). c. Tangent lines T2 are drawn between the terminal point of the normal lines and the locus of the centroid. The angle between these two tangent lines is the translational risk angle. 5.6 The entry and exit angles are then calculated. 5.7 The initial angle of intersection and the final angle of intersection are recorded, and the trajectories in between are considered to be the range of trajectories in which this particular part would be impacted by a rotor sector, and destroyed (i.e. the impact area). The intersections thus recorded are then entered on charts in tabular form so that the simultaneous effects can be studied. Refer to Figure 8. Thus it will be seen that the total systems’ effects can be determined and the worst cases identified. 5.9 If a potentially serious multiple system damage case is identified, then a more detailed analysis of the trajectory range will be carried out by breaking the failure case down into the specific fore-aft spread angle, using the individual rotor stage width instead of combined groups, if applicable. 6.0 METHODOLOGY – PROBABILITY ASSESSMENT 6.1 Those rotor burst cases that have some potential of causing a catastrophe are evaluated in the analysis in an attempt to quantify an actual probability of a catastrophe, which will, in all cases, depend on the following factors: a. The location of the engine that is the origin of the fragment, and its direction of rotation. b. The location of critical systems and critical structure. c. The rotor stage and the fragment model. d. The translational trajectory of the rotor fragment, e. The specific spread angle range of the fragment. f. The specific phase of the flight at which the failure occurs. g. The specific risk factor associated with any particular loss of function. 6.2 Engine Location The analysis should address the effects on systems during one flight after a single rotor burst has occurred, with a probability of 1.0. As the cause may be any one of the engines, the risk from each engine is later averaged for the number of engines. The analysis trajectory charts will then clearly show that certain system damage is unique to rotor fragments from a particular engine due to the direction of rotation, or, that for similar system damage the trajectory range varies considerably between engines. A risk summary should table each engine case separately with the engine location included. 6.3 Rotor Element The probability of rotor failure is assumed to be 1.0 for each of all rotor stages. For the analysis the individual risk(s) from each rotor stage of the engine should be assessed and tabled. 6.4 Translational Risk Angle The number of degrees of included arc (out of 360) at which a fragment intersects the component/structure being analyzed. Refer to Figure 6 and Figure 7. 6.5 Trajectory Probability (P) The probability of a liberated rotor fragment leaving the engine case is equal over 360, thus the probability P of that fragment hitting a system component is the identified Translational Risk Angle ɸ in degrees °, divided by 360, i.e. 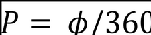 or 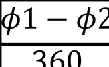 6.6 Spread Angle If the failure model of the analysis assumes a (fore and aft) spread of ± 5°, then the spread angle is a total of 10°. If a critical component can only be hit at a limited position within that spread, then the exposure of that critical component can then be factored according to the longitudinal position within the spread angle, e.g.: 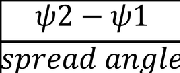 If a component can only be hit at the extreme forward range of +4° to +5°, then the factor is .1 (for one degree out of 10). 6.7 Threat Window The definition of a typical threat window is shown in Figure 7. 6.8 Phase of Flight Certain types of system damage may be catastrophic only during a specific portion of the flight profile, such as a strike on the opposite engine during take-off after V1 (i.e. a probability of 1.0), while with altitude a straight-ahead landing may be possible under certain favourable conditions (e.g. a probability of less than 1.0). The specific case can then be factored accordingly. 6.8.1 The most likely time for an uncontained rotor failure to occur is during take-off, when the engine is under highest stress. Using the industry accepted standards for the percentage of engine failures occurring within each flight phase, the following probabilities are assumed: <table border="1" cellpadding="0" cellspacing="0" width="491"><tr><td valign="top" width="245"><p>Take-off before V1</p></td><td valign="top" width="245"><p>35%</p></td></tr><tr><td valign="top" width="245"><p>V1 to first power reduction</p></td><td valign="top" width="245"><p>20%</p></td></tr><tr><td valign="top" width="245"><p>Climb</p></td><td valign="top" width="245"><p>22%</p></td></tr><tr><td valign="top" width="245"><p>Cruise</p></td><td valign="top" width="245"><p>14%</p></td></tr><tr><td valign="top" width="245"><p>Descent</p></td><td valign="top" width="245"><p>3%</p></td></tr><tr><td valign="top" width="245"><p>Approach</p></td><td valign="top" width="245"><p>2%</p></td></tr><tr><td valign="top" width="245"><p>Landing/Reverse</p></td><td valign="top" width="245"><p>4%</p></td></tr></table> 6.8.2 The flight phase failure distribution above is used in the calculations of catastrophic risk for all cases where this risk varies with flight phase. 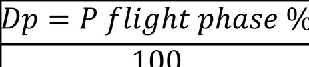 6.9 Other Risk Factors Risks such as fire, loss of pressurization, etc., are individually assessed for each case where applicable, using conservative engineering judgment. This may lead to a probability of catastrophe (i.e., risk factor) smaller than 1.0. 6.9.1 The above probabilities and factors are used in conjunction with the critical trajectory range defined to produce a probability of the specific event occurring from any random rotor burst. This value is then factored by the "risk" factor assessed for the case, to derive a calculated probability of catastrophe for each specific case. Typical conditional probability values for total loss of thrust causing catastrophic consequences are: <table border="1" cellpadding="0" cellspacing="0" width="489"><tr><td valign="top" width="264"><p><b>Phase</b></p></td><td valign="top" width="112"><p><b>Dp</b></p></td><td valign="top" width="112"><p><b>Risk</b></p></td></tr><tr><td valign="top" width="264"><p>T.O.–V1 to first power reduction</p></td><td valign="top" width="112"><p>0.20</p></td><td valign="top" width="112"><p>1.0</p></td></tr><tr><td valign="top" width="264"><p>Climb</p></td><td valign="top" width="112"><p>0.22</p></td><td valign="top" width="112"><p>0.4</p></td></tr><tr><td valign="top" width="264"><p>Cruise</p></td><td valign="top" width="112"><p>0.14</p></td><td valign="top" width="112"><p>0.2</p></td></tr><tr><td valign="top" width="264"><p>Descent</p></td><td valign="top" width="112"><p>0.03</p></td><td valign="top" width="112"><p>0.4</p></td></tr><tr><td valign="top" width="264"><p>Approach</p></td><td valign="top" width="112"><p>0.02</p></td><td valign="top" width="112"><p>0.4</p></td></tr></table> 6.10 All individual case probabilities are then tabled and summarised. 6.11 The flight mean values are obtained by averaging those for all discs or rotor stages on all engines across a nominal flight profile. The following process may be used to calculate the flight mean value for each Failure Model: a. Establish from the table in Figure 8 the threat windows where, due to combination of individual damages, a catastrophic risk exists. b. For each stage case calculate the risk for all Critical Hazards c. For each stage case apply all risk factors, and, if applicable, factor for Flight Phase-Failure distribution d. For each engine, average all stages over the total number of engine stages e. For each aeroplane, average all engines over the number of engines. 7.0 RESULTS ASSESSMENT 7.1 An applicant may show compliance with CS 23.903(b)(1) and CS 25.903(d)(1) using guidelines set forth in [AMC 20-128A](#_DxCrossRefBm1701658079). The criteria contained in the AMC may be used to show that: a. Practical design precautions have been taken to minimise the damage that can be caused by uncontained engine debris, and b. Acceptable risk levels, as specified in [AMC 20-128A](#_DxCrossRefBm1701658079), Paragraph 10, have been achieved for each critical Failure Model. 7.2 The summary of the applicable risk level criteria is shown in Table 1 below. Table 1 Summary of Acceptable Risk Level Criteria <table border="1" cellpadding="0" cellspacing="0" width="533"><tr><td valign="top" width="291"><p><b>Requirement</b></p></td><td valign="top" width="242"><p><b>Criteria</b></p></td></tr><tr><td valign="top" width="291"><p>Average 1/3 Disc Fragment</p></td><td valign="top" width="242"><p>1 in 20</p></td></tr><tr><td valign="top" width="291"><p>Average Intermediate Fragment</p></td><td valign="top" width="242"><p>1 in 40</p></td></tr><tr><td valign="top" width="291"><p>Average Alternate Model</p></td><td valign="top" width="242"><p>1 in 20 @ ± 5 degree Spread Angle</p></td></tr><tr><td valign="top" width="291"><p>Multiple Disc Fragments</p></td><td valign="top" width="242"><p>1 in 10</p></td></tr><tr><td valign="top" width="291"><p>Any single fragment (except for structural damage)</p></td><td valign="top" width="242"><p>2 x corresponding average criterion</p></td></tr></table> 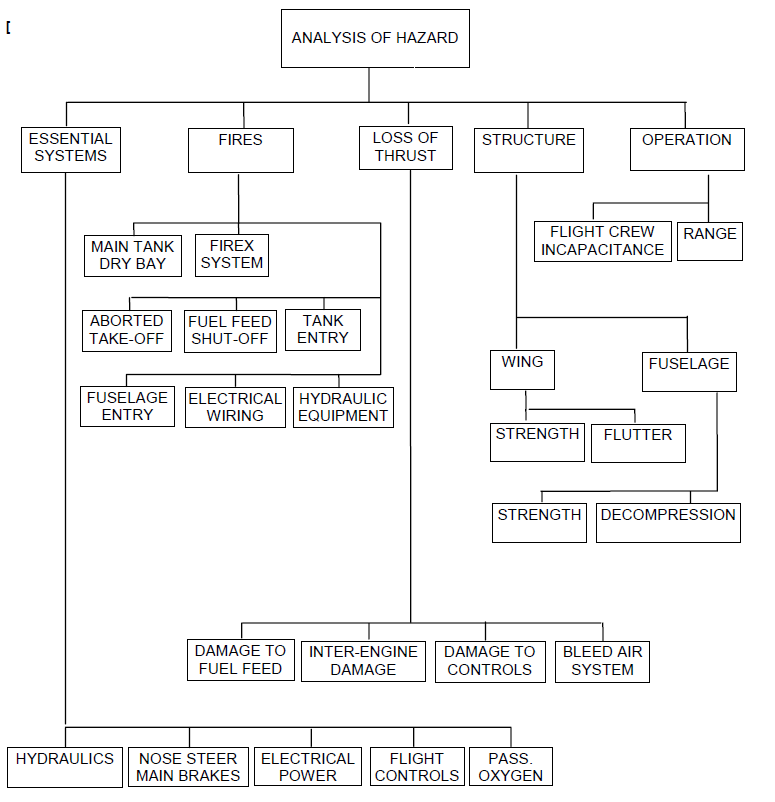 EXAMPLE – HAZARD TREE FIGURE 1 <table border="1" cellpadding="0" cellspacing="0" width="608"><tr><td valign="top" width="79"><p><b>LOC</b></p></td><td valign="top" width="143"><p><b>COMPONENT</b></p></td><td valign="top" width="143"><p><b>DAMAGE TO</b></p></td><td valign="top" width="143"><p><b>SYSTEM LOADED</b></p></td><td valign="top" width="100"><p><b>DETAIL</b></p></td></tr><tr><td valign="top" width="79"><p>LEFT</p></td><td valign="top" width="143"><p>AILERON</p></td><td valign="top" width="143"><p>CABLES/SURFACE</p></td><td valign="top" width="143"><p>HYDRAULIC POWER</p></td><td valign="top" width="100"><p>#1 & #3</p></td></tr><tr><td valign="top" width="79"><p>RIGHT</p></td><td valign="top" width="143"><p>AILERON</p></td><td valign="top" width="143"><p>CABLES/SURFACE</p></td><td valign="top" width="143"><p>HYDRAULIC POWER</p></td><td valign="top" width="100"><p>#2 & #3</p></td></tr><tr><td valign="top" width="79"><p>LEFT</p></td><td valign="top" width="143"><p>SPOILER - OUTBD MULTI-FUNCTION</p></td><td valign="top" width="143"><p>CONTROL/SURFACE</p></td><td valign="top" width="143"><p>HYDRAULIC POWER</p></td><td valign="top" width="100"><p>#1</p></td></tr><tr><td valign="top" width="79"><p>RIGHT</p></td><td valign="top" width="143"><p>SPOILER - OUTBD MULTI-FUNCTION</p></td><td valign="top" width="143"><p>CONTROL/SURFACE</p></td><td valign="top" width="143"><p>HYDRAULIC POWER</p></td><td valign="top" width="100"><p>#1</p></td></tr><tr><td valign="top" width="79"><p>LEFT</p></td><td valign="top" width="143"><p>FLAP-OUTBD</p></td><td valign="top" width="143"><p>TRACK/SURFACE</p></td><td valign="top" width="143"><p>ELECTRICAL POWER</p></td><td valign="top" width="100"><p>AC BUS1</p><p>AC ESS</p></td></tr><tr><td valign="top" width="79"><p>RIGHT</p></td><td valign="top" width="143"><p>FLAP-OUTBD</p></td><td valign="top" width="143"><p>TRACK/SURFACE</p></td><td valign="top" width="143"><p>ELECTRICAL POWER</p></td><td valign="top" width="100"><p>AC BUS1</p><p>AC ESS</p></td></tr><tr><td valign="top" width="79"><p>LEFT</p></td><td valign="top" width="143"><p>RUDDER</p></td><td valign="top" width="143"><p>CABLE</p></td><td valign="top" width="143"><p>HYDRAULIC POWER</p></td><td valign="top" width="100"><p>#1,#2&#3</p></td></tr><tr><td valign="top" width="79"><p>RIGHT</p></td><td valign="top" width="143"><p>RUDDER</p></td><td valign="top" width="143"><p>CABLE</p></td><td valign="top" width="143"><p>HYDRAULIC POWER</p></td><td valign="top" width="100"><p>#1,#2&#3</p></td></tr><tr><td valign="top" width="79"><p>LEFT</p></td><td valign="top" width="143"><p>ELEVATOR</p></td><td valign="top" width="143"><p>CABLES</p><p>Note 1</p></td><td valign="top" width="143"><p>HYDRAULIC POWER</p></td><td valign="top" width="100"><p>#1 & #3</p></td></tr><tr><td valign="top" width="79"><p>RIGHT</p></td><td valign="top" width="143"><p>ELEVATOR</p></td><td valign="top" width="143"><p>CABLES</p><p>Note 1</p></td><td valign="top" width="143"><p>HYDRAULIC POWER</p></td><td valign="top" width="100"><p>#2 & #3</p></td></tr><tr><td valign="top" width="79"><p>CHAN1</p></td><td valign="top" width="143"><p>PITCH TRIM</p></td><td valign="top" width="143"><p>CONTROL/POWER</p><p>Note 2</p></td><td valign="top" width="143"><p>ELECTRICAL POWER</p></td><td valign="top" width="100"><p>AC BUS1</p><p>DC BUS1</p></td></tr><tr><td valign="top" width="79"><p>CHAN2</p></td><td valign="top" width="143"><p>PITCH TRIM</p></td><td valign="top" width="143"><p>CONTROL/POWER</p><p>Note 2</p></td><td valign="top" width="143"><p>ELECTRICAL POWER</p></td><td valign="top" width="100"><p>AC ESS</p><p>DC ESS</p></td></tr></table> FLIGHT CONTROLS – SYSTEM LOADING Note 1: Same fragment path must not sever: ON-SIDE cables + OFF-SIDE hydraulic system + HYDRAULIC PWR #3 e.g.: Left elevator cable and HYDRAULIC PWR #2 and #3 or, Right elevator cable and HYDRAULIC PWR # 1 and # 3 Note 2: Same fragment path must not sever: — Both CHAN1 and CHAN2 circuits — ON-SIDE control circuit + OFF-SIDE power circuit — OFF-SIDE control circuit + ON-SIDE power circuit EXAMPLE – SYSTEM LOADING MATRIX FIGURE 2 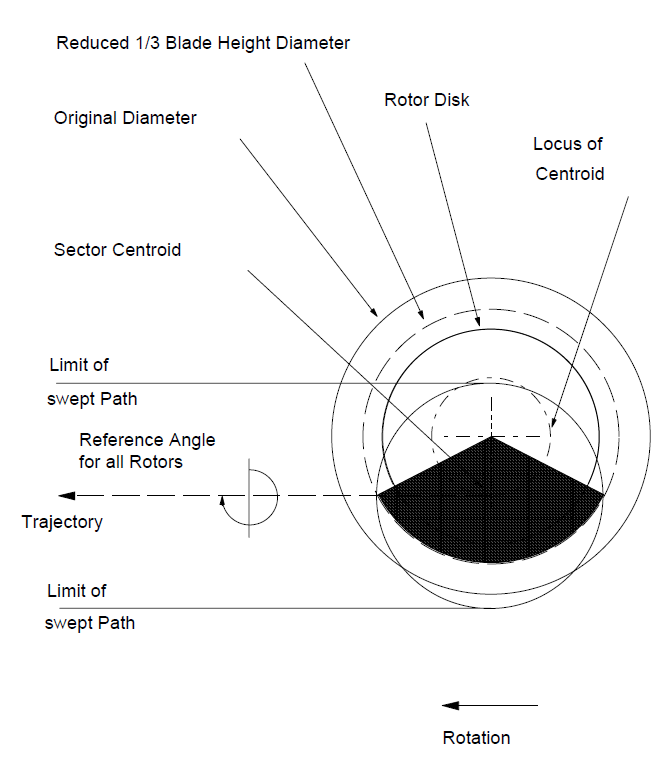 TRI-SECTOR ROTOR BURST FIGURE 3 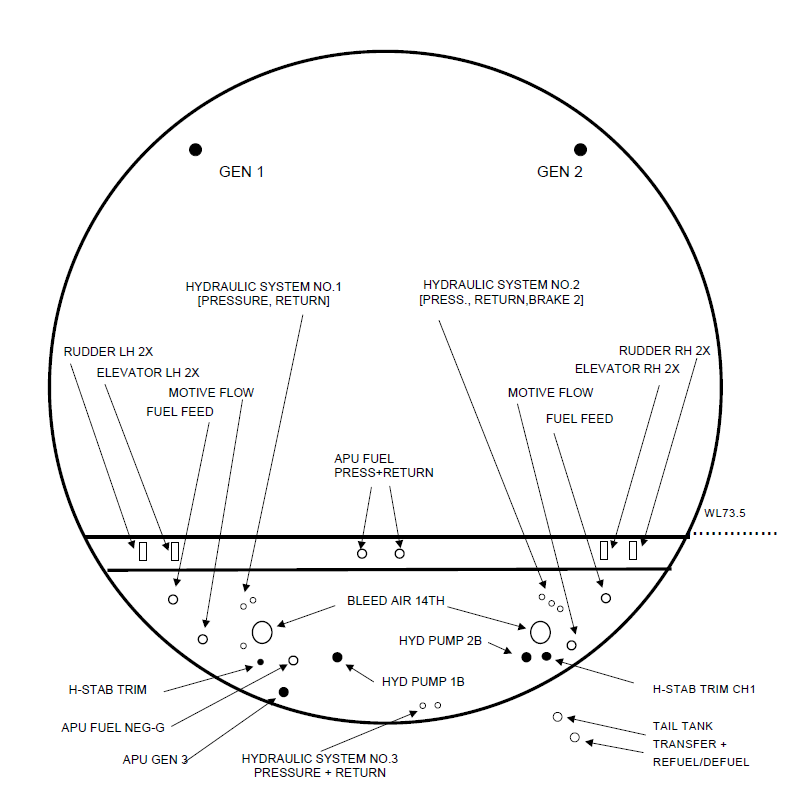 TYPICAL LAYOUT OF SYSTEMS IN ROTOR PLANE FIGURE 4 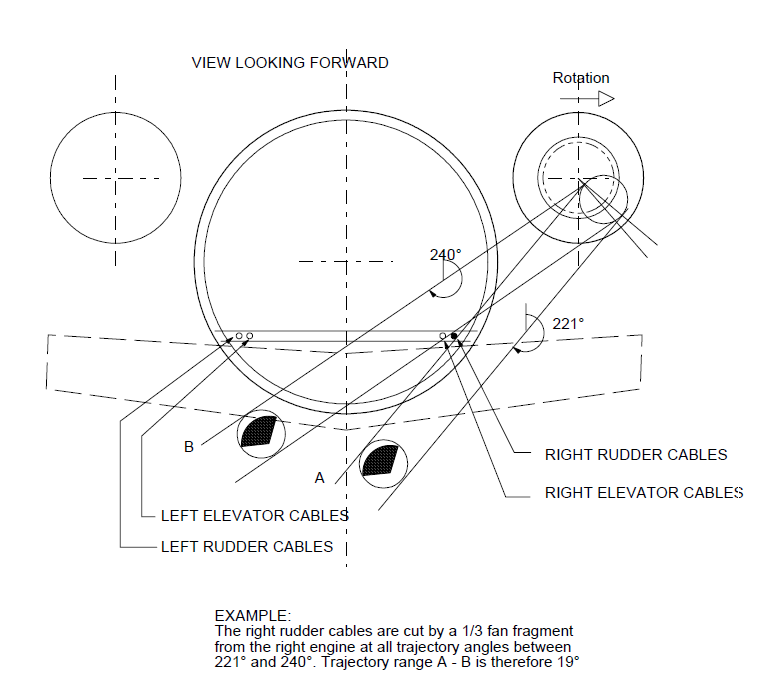 TRAJECTORY RANGE PLOTTING FIGURE 5 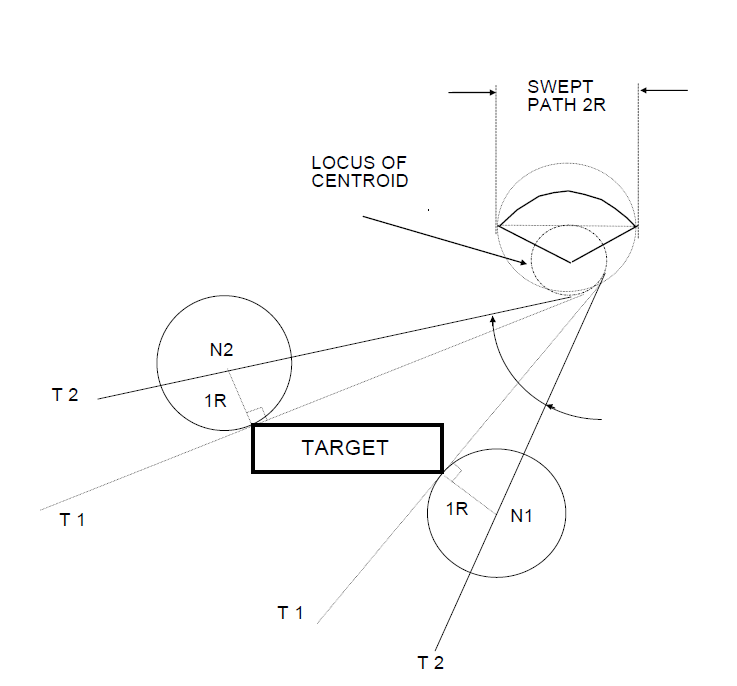 TYPICAL TRAJECTORY PLOTTING FIGURE 6 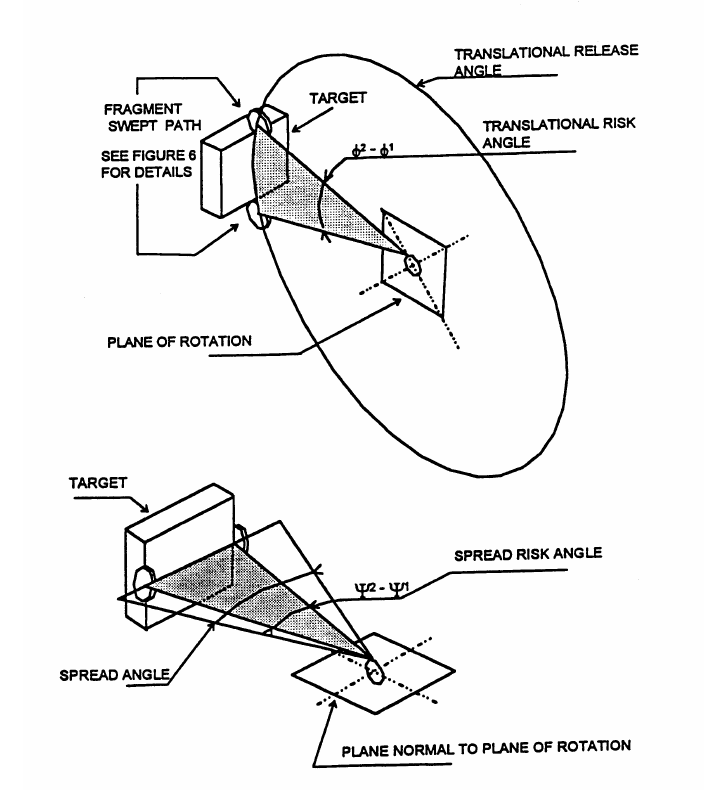 DEFINITION - THREAT WINDOW FIGURE 7 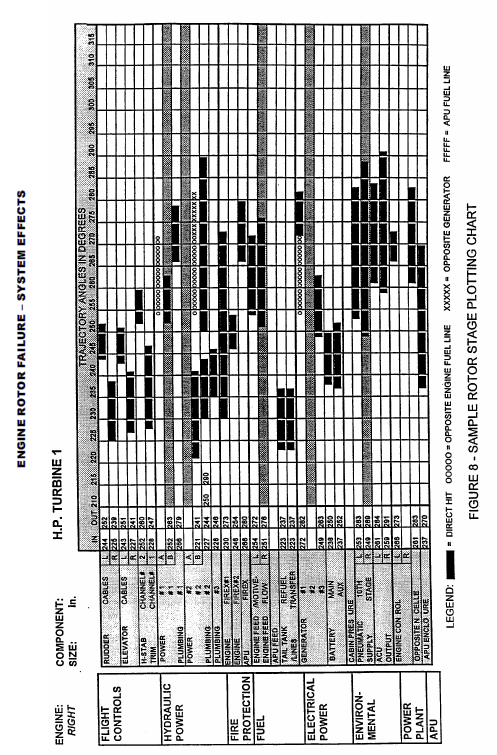
Appendix 1 to AMC 20-128A User’s Manual ED Decision 2003/12/RM RISK ANALYSIS METHODOLOGY for UNCONTAINED ENGINE/APU FAILURE INDEX 1.0 GENERAL 2.0 SCOPE 3.0 FUNDAMENTAL COMPONENTS OF A SAFETY AND RISK ANALYSIS 4.0 ASSUMPTIONS 5.0 PLOTTING 6.0 METHODOLOGY – PROBABILITY ASSESSMENT 7.0 RESULTS ASSESSMENT <table border="0" cellpadding="0" cellspacing="0" width="591"> <tr> <td valign="top" width="72"> <p>FIGURE 1</p> </td> <td valign="top" width="519"> <p>EXAMPLE – HAZARD TREE</p> </td> </tr> <tr> <td valign="top" width="72"> <p>FIGURE 2</p> </td> <td valign="top" width="519"> <p>EXAMPLE – SYSTEM LOADING MATRIX</p> </td> </tr> <tr> <td valign="top" width="72"> <p>FIGURE 3</p> </td> <td valign="top" width="519"> <p>TRI-SECTOR ROTOR BURST</p> </td> </tr> <tr> <td valign="top" width="72"> <p>FIGURE 4</p> </td> <td valign="top" width="519"> <p>TYPICAL LAYOUT OF SYSTEMS IN ROTOR PLANE</p> </td> </tr> <tr> <td valign="top" width="72"> <p>FIGURE 5</p> </td> <td valign="top" width="519"> <p>TRAJECTORY RANGE PLOTTING</p> </td> </tr> <tr> <td valign="top" width="72"> <p>FIGURE 6</p> </td> <td valign="top" width="519"> <p>TYPICAL TRAJECTORY PLOTTING</p> </td> </tr> <tr> <td valign="top" width="72"> <p>FIGURE 7</p> </td> <td valign="top" width="519"> <p>DEFINITION – THREAT WINDOW</p> </td> </tr> <tr> <td valign="top" width="72"> <p>FIGURE 8</p> </td> <td valign="top" width="519"> <p>SAMPLE ROTOR STAGE PLOTTING CHART</p> </td> </tr> </table> 1.0 GENERAL 1.1 The design of aeroplane and engine systems and the location of the engines relative to critical systems and structure have a significant impact on survivability of the aeroplane following an uncontained engine failure. CS 23.903(b)(1) and 25.903(d)(1) of the EASA Certification Specifications (CS) require that design precautions be taken to minimise the hazard to the aeroplane due to uncontained failures of engine or auxiliary power unit (APU). [AMC 20-128A](#_DxCrossRefBm1926189323) provides guidance for demonstrating compliance with these requirements. 1.2 As a part of this compliance demonstration, it is necessary to quantitatively assess the risk of a catastrophic failure in the event of an uncontained engine failure. This User’s Manual describes an acceptable method for this purpose. 1.3 The objective of the risk analysis is to measure the remaining risk after prudent and practical design considerations have been taken. Since each aeroplane would have unique features which must be considered when applying the methods described in this manual, there should be some flexibility in the methods and procedures. 1.4 It is a preferred approach to use these methods throughout the development of an aeroplane design to identify problem areas at an early stage when appropriate design changes are least disruptive. It is also advisable to involve the European Aviation Safety Agency (EASA) in this process at an early stage when appropriate interpretation of the methodology and documentation requirements can be established. 1.5 It should be noted that although the risk analysis produces quantitative results, subjective assessments are inherent in the methods of the analysis regarding the criticality of specific types of aeroplane component failures. Assumptions for such assessments should be documented along with the numerical results. 1.6 Aeroplane manufacturers have each developed their own method of assessing the effects of rotor failure, as there are many ways to get to the same result. This User’s Manual identifies all the elements that should be contained in an analysis, so that it can be interpreted by a person not familiar with such a process. 1.7 The intent of this manual therefore is to aid in establishing how an analysis is prepared, without precluding any technological advances or existing proprietary processes. 1.8 AMC 20-128A makes allowance for the broad configuration of the aeroplane as such damage to the structure due to rotor failure generally allows for little flexibility in design. System lay-out within a rotor burst zone, however, can be optimized. 1.9 Damage to structure, which may involve stress analysis, generally can be analyzed separately, and later coordinated with simultaneous system effects. 1.10 For an analysis of the effects on systems due to a rotor failure the aeroplane must be evaluated as a whole; and a risk analysis must specifically highlight all critical cases identified which have any potential to result in a catastrophe. 1.11 Such an analysis can then be used to establish that reasonable precautions have been taken to minimise the hazards, and that the remaining hazards are an acceptable risk. 1.12 A safety and a risk analysis are interdependent, as the risk analysis must be based on the safety analysis. The safety analysis therefore is the starting point that identifies potential hazardous or catastrophic effects from a rotor failure and is the basic tool to minimise the hazard in accordance with the guidelines of [AMC 20-128A](#_DxCrossRefBm1926189323). 1.13 The risk analysis subsequently assesses and quantifies the residual risk to the aeroplane. 2.0 SCOPE The following describes the scope of analyses required to assess the aeroplane risk levels against the criteria set forth in Paragraph 10 of [AMC 20-128A](#_DxCrossRefBm1926189323). 2.1 Safety Analysis is required to identify the critical hazards that may be numerically analyzed (hazards remaining after all practical design precautions have been taken). Functional criticality will vary by aeroplane and may vary by flight phase. Thorough understanding of each aeroplane structure and system functions is required to establish the criticality relative to each fragment trajectory path of the theoretical failure. Assistance from experts within each discipline is typically required to assure accuracy of the analysis in such areas as effects of fuel tank penetration on leakage paths and ignition hazards, thrust level control (for loss of thrust assessment), structural capabilities (for fuselage impact assessment), aeroplane controllability (for control cables impact assessment), and fuel asymmetry. 2.2 Risk For each remaining critical hazard, the following assessments may be prepared using the engine/APU failure models as defined in Paragraph 9 of [AMC 20-128A](#_DxCrossRefBm1926189323): a. Flight mean risk for single 1/3 disc fragment. b. Flight mean risk for single intermediate fragment. c. Flight mean risk for alternate model (when used as an alternate to the 1/3 disc fragment and intermediate fragment). d. Multiple 1/3 disc fragments for duplicated or multiplicated systems. e. Specific risk for single 1/3 disc fragment and single intermediate fragment. f. Specific risk for any single disc fragment that may result in catastrophic structural damage. The risk level criteria for each failure model are defined in Paragraph 10 of [AMC 20-128A](#_DxCrossRefBm1926189323). 3.0 FUNDAMENTAL COMPONENTS OF A SAFETY AND RISK ANALYSIS 3.1 The logical steps for a complete analysis are: a. Establish at the design definition the functional hazards that can arise from the combined or concurrent failures of individual systems, including multiplicated systems and critical structure. b. Establish a Functional Hazard Tree (see Figure 1), or a System Matrix (see Figure 2) that identifies all system interdependencies and failure combinations that must be avoided (if possible) when locating equipment in the rotor burst impact area. In theory, if this is carried out to the maximum, no critical system hazards other than opposite engine or fuel line hits would exist. c. Establish the fragment trajectories and trajectory ranges both for translational and spread risk angles for each damage. Plot these on a chart or graph, and identify the trajectory ranges that could result in hazardous combinations (threats) as per the above system matrix or functional hazard analysis. d. Apply risk factors, such as phase of flight or other, to these threats, and calculate the risk for each threat for each rotor stage. e. Tabulate, summarize and average all cases. 3.2 In accordance with [AMC 20-128A](#_DxCrossRefBm1926189323) the risk to the aeroplane due to uncontained rotor failure is assessed to the effects, once such a failure has occurred. The probability of occurrence of rotor failure, as analyzed with the probability methods of AMC 25.1309 (i.e. probability as a function of critical uncontained rotor failure rate and exposure time), does not apply. 3.3 The total risk level to the aeroplane, as identified by the risk analysis, is the mean value obtained by averaging the values of all rotor stages of all engines of the aeroplane, expressed as Flight Mean Risk. 4.0 ASSUMPTIONS 4.1 The following conservative assumptions, in addition to those in Paragraphs 10(a)(1), (2) and (3) of [AMC 20-128A](#_DxCrossRefBm1926189323), have been made in some previous analyses. However, each aeroplane design may have unique characteristics and therefore a unique basis for the safety assessment leading to the possibility of different assumptions. All assumptions should be substantiated within the analysis: a. The 1/3 disc fragment as modeled in Paragraph 9(a) of the [AMC 20-128A](#_DxCrossRefBm1926189323) travels along a trajectory path that is tangential to the sector centroid locus, in the direction of rotor rotation (Refer to Figure 3). The sector fragment rotates about its centroid without tumbling and sweeps a path equal to twice the greatest radius that can be struck from the sector centroid that intersects its periphery. The fragment is considered to possess infinite energy, and therefore to be capable of severing lines, wiring, cables and unprotected structure in its path, and to be undeflected from its original trajectory unless deflection shields are fitted. However, protective shielding or an engine being impacted may be assumed to have sufficient mass to stop even the most energetic fragment. b. The probability of release of debris within the maximum spread angle is uniformly distributed over all directions. c. The effects of severed electrical wiring are dependent on the configuration of the affected system. In general, severed wiring is assumed to not receive inadvertent positive voltage for any significant duration. d. Control cables that are struck by a fragment disconnect. e. Hydraulically actuated, cable driven control surfaces, which do not have designated “fail to” settings, tend to fail to null when control cables are severed. Subsequent surface float is progressive and predictable. f. Systems components are considered unserviceable if their envelope has been touched. In case of an engine being impacted, the nacelle structure may be regarded as engine envelope, unless damage is not likely to be hazardous. g. Uncontained events involving in-flight penetration of fuel tanks will not result in fuel tank explosion. h. Unpowered flight and off-airport landings, including ditching, may be assumed to be not catastrophic to the extent validated by accident statistics or other accepted factors. i. Damage to structure essential for completion of flight is catastrophic (Ref. [AMC 20-128A](#_DxCrossRefBm1926189323), Paragraph 10.b(1)). j. The flight begins when engine power is advanced for takeoff and ends after landing when turning off the runway. 5.0 PLOTTING 5.1 Cross-section and plan view layouts of the aeroplane systems in the ranges of the rotor burst impact areas should be prepared, either as drawings, or as computer models These layouts should plot the precise location of the critical system components, including fuel and hydraulic lines, flight control cables, electric wiring harnesses and junction boxes, pneumatic and environmental system ducting, fire extinguishing; critical structure, etc. 5.2 For every rotor stage a plane is developed. Each of these planes contains a view of all the system components respective outer envelopes, which is then used to generate a cross-section. See Figure 4. 5.3 Models or drawings representing the various engine rotor stages and their fore and aft deviation are then generated. 5.4 The various trajectory paths generated for each engine rotor stage are then superimposed on the cross-section layouts of the station planes that are in the range of that potential rotor burst in order to study the effects (see Figure 5). Thus separate plots are generated for each engine rotor stage or rotor group. To reduce the amount of an analysis the engine rotor stages may also be considered as groups, as applicable for the engine type, using the largest rotor stage diameter of the group. 5.5 These trajectory paths may be generated as follows and as shown in Figure 6: a. Two tangent lines T1 are drawn between the locus of the centroid and the target envelope. b. At the tangent line touch points, lines N1 and N2 normal to the tangent lines, are drawn with the length equal to the radius of the fragment swept path (as also shown in Figure 1). c. Tangent lines T2 are drawn between the terminal point of the normal lines and the locus of the centroid. The angle between these two tangent lines is the translational risk angle. 5.6 The entry and exit angles are then calculated. 5.7 The initial angle of intersection and the final angle of intersection are recorded, and the trajectories in between are considered to be the range of trajectories in which this particular part would be impacted by a rotor sector, and destroyed (i.e. the impact area). The intersections thus recorded are then entered on charts in tabular form so that the simultaneous effects can be studied. Refer to Figure 8. Thus it will be seen that the total systems’ effects can be determined and the worst cases identified. 5.9 If a potentially serious multiple system damage case is identified, then a more detailed analysis of the trajectory range will be carried out by breaking the failure case down into the specific fore-aft spread angle, using the individual rotor stage width instead of combined groups, if applicable. 6.0 METHODOLOGY – PROBABILITY ASSESSMENT 6.1 Those rotor burst cases that have some potential of causing a catastrophe are evaluated in the analysis in an attempt to quantify an actual probability of a catastrophe, which will, in all cases, depend on the following factors: a. The location of the engine that is the origin of the fragment, and its direction of rotation. b. The location of critical systems and critical structure. c. The rotor stage and the fragment model. d. The translational trajectory of the rotor fragment, e. The specific spread angle range of the fragment. f. The specific phase of the flight at which the failure occurs. g. The specific risk factor associated with any particular loss of function. 6.2 Engine Location The analysis should address the effects on systems during one flight after a single rotor burst has occurred, with a probability of 1.0. As the cause may be any one of the engines, the risk from each engine is later averaged for the number of engines. The analysis trajectory charts will then clearly show that certain system damage is unique to rotor fragments from a particular engine due to the direction of rotation, or, that for similar system damage the trajectory range varies considerably between engines. A risk summary should table each engine case separately with the engine location included. 6.3 Rotor Element The probability of rotor failure is assumed to be 1.0 for each of all rotor stages. For the analysis the individual risk(s) from each rotor stage of the engine should be assessed and tabled. 6.4 Translational Risk Angle The number of degrees of included arc (out of 360) at which a fragment intersects the component/structure being analyzed. Refer to Figure 6 and Figure 7. 6.5 Trajectory Probability (P) The probability of a liberated rotor fragment leaving the engine case is equal over 360, thus the probability P of that fragment hitting a system component is the identified Translational Risk Angle ɸ in degrees °, divided by 360, i.e. if !msEquation? or if !msEquation?![Aviation.Bot AI suggestion, not from EASA source: \[\frac{\phi 1 - \phi 2}{360}\]](/static/files/file_tNNDI2wQkpg/image058.png) 6.6 Spread Angle If the failure model of the analysis assumes a (fore and aft) spread of ± 5°, then the spread angle is a total of 10°. If a critical component can only be hit at a limited position within that spread, then the exposure of that critical component can then be factored according to the longitudinal position within the spread angle, e.g.: if !msEquation?![Aviation.Bot AI suggestion, not from EASA source: \[\frac{\psi 2 - \psi 1}{\textit{spread angle}}\]](/static/files/file_tNNDI2wQkpg/image059.png) If a component can only be hit at the extreme forward range of +4° to +5°, then the factor is .1 (for one degree out of 10). 6.7 Threat Window The definition of a typical threat window is shown in Figure 7. 6.8 Phase of Flight Certain types of system damage may be catastrophic only during a specific portion of the flight profile, such as a strike on the opposite engine during take-off after V1 (i.e. a probability of 1.0), while with altitude a straight-ahead landing may be possible under certain favourable conditions (e.g. a probability of less than 1.0). The specific case can then be factored accordingly. 6.8.1 The most likely time for an uncontained rotor failure to occur is during take-off, when the engine is under highest stress. Using the industry accepted standards for the percentage of engine failures occurring within each flight phase, the following probabilities are assumed: <table border="1" cellpadding="0" cellspacing="0" width="491"> <tr> <td valign="top" width="245"> <p>Take-off before V1</p> </td> <td valign="top" width="245"> <p>35%</p> </td> </tr> <tr> <td valign="top" width="245"> <p>V1 to first power reduction</p> </td> <td valign="top" width="245"> <p>20%</p> </td> </tr> <tr> <td valign="top" width="245"> <p>Climb</p> </td> <td valign="top" width="245"> <p>22%</p> </td> </tr> <tr> <td valign="top" width="245"> <p>Cruise</p> </td> <td valign="top" width="245"> <p>14%</p> </td> </tr> <tr> <td valign="top" width="245"> <p>Descent</p> </td> <td valign="top" width="245"> <p>3%</p> </td> </tr> <tr> <td valign="top" width="245"> <p>Approach</p> </td> <td valign="top" width="245"> <p>2%</p> </td> </tr> <tr> <td valign="top" width="245"> <p>Landing/Reverse</p> </td> <td valign="top" width="245"> <p>4%</p> </td> </tr> </table> 6.8.2 The flight phase failure distribution above is used in the calculations of catastrophic risk for all cases where this risk varies with flight phase. if !msEquation?![Aviation.Bot AI suggestion, not from EASA source: \[Dp = \frac{P_{flight\ phase\ \%}}{100}\]](/static/files/file_tNNDI2wQkpg/image060.png) 6.9 Other Risk Factors Risks such as fire, loss of pressurization, etc., are individually assessed for each case where applicable, using conservative engineering judgment. This may lead to a probability of catastrophe (i.e., risk factor) smaller than 1.0. 6.9.1 The above probabilities and factors are used in conjunction with the critical trajectory range defined to produce a probability of the specific event occurring from any random rotor burst. This value is then factored by the "risk" factor assessed for the case, to derive a calculated probability of catastrophe for each specific case. Typical conditional probability values for total loss of thrust causing catastrophic consequences are: <table border="1" cellpadding="0" cellspacing="0" width="489"> <tr> <td valign="top" width="264"> <p><b>Phase</b></p> </td> <td valign="top" width="112"> <p><b>Dp</b></p> </td> <td valign="top" width="112"> <p><b>Risk</b></p> </td> </tr> <tr> <td valign="top" width="264"> <p>T.O.–V1 to first power reduction</p> </td> <td valign="top" width="112"> <p>0.20</p> </td> <td valign="top" width="112"> <p>1.0</p> </td> </tr> <tr> <td valign="top" width="264"> <p>Climb</p> </td> <td valign="top" width="112"> <p>0.22</p> </td> <td valign="top" width="112"> <p>0.4</p> </td> </tr> <tr> <td valign="top" width="264"> <p>Cruise</p> </td> <td valign="top" width="112"> <p>0.14</p> </td> <td valign="top" width="112"> <p>0.2</p> </td> </tr> <tr> <td valign="top" width="264"> <p>Descent</p> </td> <td valign="top" width="112"> <p>0.03</p> </td> <td valign="top" width="112"> <p>0.4</p> </td> </tr> <tr> <td valign="top" width="264"> <p>Approach</p> </td> <td valign="top" width="112"> <p>0.02</p> </td> <td valign="top" width="112"> <p>0.4</p> </td> </tr> </table> 6.10 All individual case probabilities are then tabled and summarised. 6.11 The flight mean values are obtained by averaging those for all discs or rotor stages on all engines across a nominal flight profile. The following process may be used to calculate the flight mean value for each Failure Model: a. Establish from the table in Figure 8 the threat windows where, due to combination of individual damages, a catastrophic risk exists. b. For each stage case calculate the risk for all Critical Hazards c. For each stage case apply all risk factors, and, if applicable, factor for Flight Phase-Failure distribution d. For each engine, average all stages over the total number of engine stages e. For each aeroplane, average all engines over the number of engines. 7.0 RESULTS ASSESSMENT 7.1 An applicant may show compliance with CS 23.903(b)(1) and CS 25.903(d)(1) using guidelines set forth in [AMC 20-128A](#_DxCrossRefBm1926189323). The criteria contained in the AMC may be used to show that: a. Practical design precautions have been taken to minimise the damage that can be caused by uncontained engine debris, and b. Acceptable risk levels, as specified in [AMC 20-128A](#_DxCrossRefBm1926189323), Paragraph 10, have been achieved for each critical Failure Model. 7.2 The summary of the applicable risk level criteria is shown in Table 1 below. Table 1 Summary of Acceptable Risk Level Criteria <table border="1" cellpadding="0" cellspacing="0" width="533"> <tr> <td valign="top" width="291"> <p><b>Requirement</b></p> </td> <td valign="top" width="242"> <p><b>Criteria</b></p> </td> </tr> <tr> <td valign="top" width="291"> <p>Average 1/3 Disc Fragment</p> </td> <td valign="top" width="242"> <p>1 in 20</p> </td> </tr> <tr> <td valign="top" width="291"> <p>Average Intermediate Fragment</p> </td> <td valign="top" width="242"> <p>1 in 40</p> </td> </tr> <tr> <td valign="top" width="291"> <p>Average Alternate Model</p> </td> <td valign="top" width="242"> <p>1 in 20 @ ± 5 degree Spread Angle</p> </td> </tr> <tr> <td valign="top" width="291"> <p>Multiple Disc Fragments</p> </td> <td valign="top" width="242"> <p>1 in 10</p> </td> </tr> <tr> <td valign="top" width="291"> <p>Any single fragment (except for structural damage)</p> </td> <td valign="top" width="242"> <p>2 x corresponding average criterion</p> </td> </tr> </table> ![Aviation.Bot AI suggestion, not from EASA source: The image displays a hierarchical flowchart illustrating the "ANALYSIS OF HAZARD" for uncontained engine/APU failure, detailing various potential hazards and their sub-categories. Detailed Description: The image is a flowchart composed of rectangular nodes with black borders and white backgrounds, containing black text, connected by solid black lines. At the top, there is a single root node labeled "ANALYSIS OF HAZARD". A vertical line descends from "ANALYSIS OF HAZARD" and branches horizontally to connect to five primary hazard categories, arranged from left to right: 1. "ESSENTIAL SYSTEMS" 2. "FIRES" 3. "LOSS OF THRUST" 4. "STRUCTURE" 5. "OPERATION" From "ESSENTIAL SYSTEMS", a vertical line descends and branches horizontally to connect to five sub-categories, arranged from left to right at the bottom of the chart: * "HYDRAULICS" * "NOSE STEER MAIN BRAKES" * "ELECTRICAL POWER" * "FLIGHT CONTROLS" * "PASS. OXYGEN" From "FIRES", a vertical line descends and branches horizontally to connect to two sub-categories: * "MAIN TANK DRY BAY" (left) * "FIREX SYSTEM" (right) From "MAIN TANK DRY BAY", a vertical line descends and branches horizontally to connect to three further sub-categories: * "ABORTED TAKE-OFF" (left) * "FUEL FEED SHUT-OFF" (middle) * "TANK ENTRY" (right) From "ABORTED TAKE-OFF", a vertical line descends and branches horizontally to connect to three further sub-categories: * "FUSELAGE ENTRY" (left) * "ELECTRICAL WIRING" (middle) * "HYDRAULIC EQUIPMENT" (right) From "LOSS OF THRUST", a vertical line descends and branches horizontally to connect to four sub-categories: * "DAMAGE TO FUEL FEED" (left) * "INTER-ENGINE DAMAGE" (middle-left) * "DAMAGE TO CONTROLS" (middle-right) * "BLEED AIR SYSTEM" (right) From "STRUCTURE", a vertical line descends and branches horizontally to connect to two sub-categories: * "WING" (left) * "FUSELAGE" (right) From "WING", a vertical line descends and branches horizontally to connect to two further sub-categories: * "STRENGTH" (left) * "FLUTTER" (right) From "FUSELAGE", a vertical line descends and branches horizontally to connect to two further sub-categories: * "STRENGTH" (left) * "DECOMPRESSION" (right) From "OPERATION", a vertical line descends and branches horizontally to connect to two sub-categories: * "FLIGHT CREW INCAPACITANCE" (left) * "RANGE" (right) Contextual Linkage: The flowchart visually represents a hierarchical decomposition of potential hazards. The connections between nodes indicate a breakdown from a broader hazard category to more specific sub-categories or consequences. For instance, "ANALYSIS OF HAZARD" is the overarching subject, which is then broken down into primary hazard types like "FIRES" or "STRUCTURE". Each primary hazard is further detailed into specific scenarios or affected components, such as "MAIN TANK DRY BAY" under "FIRES", or "WING" and "FUSELAGE" under "STRUCTURE". This structure provides a systematic overview of the various aspects to consider when analyzing hazards. "mermaid graph TD A[ANALYSIS OF HAZARD] --> B[ESSENTIAL SYSTEMS] A --> C[FIRES] A --> D[LOSS OF THRUST] A --> E[STRUCTURE] A --> F[OPERATION] B --> G[HYDRAULICS] B --> H[NOSE STEER MAIN BRAKES] B --> I[ELECTRICAL POWER] B --> J[FLIGHT CONTROLS] B --> K[PASS. OXYGEN] C --> L[MAIN TANK DRY BAY] C --> M[FIREX SYSTEM] L --> N[ABORTED TAKE-OFF] L --> O[FUEL FEED SHUT-OFF] L --> P[TANK ENTRY] N --> Q[FUSELAGE ENTRY] N --> R[ELECTRICAL WIRING] N --> S[HYDRAULIC EQUIPMENT] D --> T[DAMAGE TO FUEL FEED] D --> U[INTER-ENGINE DAMAGE] D --> V[DAMAGE TO CONTROLS] D --> W[BLEED AIR SYSTEM] E --> X[WING] E --> Y[FUSELAGE] X --> Z[STRENGTH] X --> AA[FLUTTER] Y --> AB[STRENGTH] Y --> AC[DECOMPRESSION] F --> AD[FLIGHT CREW INCAPACITANCE] F --> AE[RANGE] "](file_tNNDI2wQkpg/image061.png) EXAMPLE – HAZARD TREE FIGURE 1 <table border="1" cellpadding="0" cellspacing="0" width="608"> <tr> <td valign="top" width="79"> <p><b>LOC</b></p> </td> <td valign="top" width="143"> <p><b>COMPONENT</b></p> </td> <td valign="top" width="143"> <p><b>DAMAGE TO</b></p> </td> <td valign="top" width="143"> <p><b>SYSTEM LOADED</b></p> </td> <td valign="top" width="100"> <p><b>DETAIL</b></p> </td> </tr> <tr> <td valign="top" width="79"> <p>LEFT</p> </td> <td valign="top" width="143"> <p>AILERON</p> </td> <td valign="top" width="143"> <p>CABLES/SURFACE</p> </td> <td valign="top" width="143"> <p>HYDRAULIC POWER</p> </td> <td valign="top" width="100"> <p>#1 & #3</p> </td> </tr> <tr> <td valign="top" width="79"> <p>RIGHT</p> </td> <td valign="top" width="143"> <p>AILERON</p> </td> <td valign="top" width="143"> <p>CABLES/SURFACE</p> </td> <td valign="top" width="143"> <p>HYDRAULIC POWER</p> </td> <td valign="top" width="100"> <p>#2 & #3</p> </td> </tr> <tr> <td valign="top" width="79"> <p>LEFT</p> </td> <td valign="top" width="143"> <p>SPOILER - OUTBD MULTI-FUNCTION</p> </td> <td valign="top" width="143"> <p>CONTROL/SURFACE</p> </td> <td valign="top" width="143"> <p>HYDRAULIC POWER</p> </td> <td valign="top" width="100"> <p>#1</p> </td> </tr> <tr> <td valign="top" width="79"> <p>RIGHT</p> </td> <td valign="top" width="143"> <p>SPOILER - OUTBD MULTI-FUNCTION</p> </td> <td valign="top" width="143"> <p>CONTROL/SURFACE</p> </td> <td valign="top" width="143"> <p>HYDRAULIC POWER</p> </td> <td valign="top" width="100"> <p>#1</p> </td> </tr> <tr> <td valign="top" width="79"> <p>LEFT</p> </td> <td valign="top" width="143"> <p>FLAP-OUTBD</p> </td> <td valign="top" width="143"> <p>TRACK/SURFACE</p> </td> <td valign="top" width="143"> <p>ELECTRICAL POWER</p> </td> <td valign="top" width="100"> <p>AC BUS1</p> <p>AC ESS</p> </td> </tr> <tr> <td valign="top" width="79"> <p>RIGHT</p> </td> <td valign="top" width="143"> <p>FLAP-OUTBD</p> </td> <td valign="top" width="143"> <p>TRACK/SURFACE</p> </td> <td valign="top" width="143"> <p>ELECTRICAL POWER</p> </td> <td valign="top" width="100"> <p>AC BUS1</p> <p>AC ESS</p> </td> </tr> <tr> <td valign="top" width="79"> <p>LEFT</p> </td> <td valign="top" width="143"> <p>RUDDER</p> </td> <td valign="top" width="143"> <p>CABLE</p> </td> <td valign="top" width="143"> <p>HYDRAULIC POWER</p> </td> <td valign="top" width="100"> <p>#1,#2&#3</p> </td> </tr> <tr> <td valign="top" width="79"> <p>RIGHT</p> </td> <td valign="top" width="143"> <p>RUDDER</p> </td> <td valign="top" width="143"> <p>CABLE</p> </td> <td valign="top" width="143"> <p>HYDRAULIC POWER</p> </td> <td valign="top" width="100"> <p>#1,#2&#3</p> </td> </tr> <tr> <td valign="top" width="79"> <p>LEFT</p> </td> <td valign="top" width="143"> <p>ELEVATOR</p> </td> <td valign="top" width="143"> <p>CABLES</p> <p>Note 1</p> </td> <td valign="top" width="143"> <p>HYDRAULIC POWER</p> </td> <td valign="top" width="100"> <p>#1 & #3</p> </td> </tr> <tr> <td valign="top" width="79"> <p>RIGHT</p> </td> <td valign="top" width="143"> <p>ELEVATOR</p> </td> <td valign="top" width="143"> <p>CABLES</p> <p>Note 1</p> </td> <td valign="top" width="143"> <p>HYDRAULIC POWER</p> </td> <td valign="top" width="100"> <p>#2 & #3</p> </td> </tr> <tr> <td valign="top" width="79"> <p>CHAN1</p> </td> <td valign="top" width="143"> <p>PITCH TRIM</p> </td> <td valign="top" width="143"> <p>CONTROL/POWER</p> <p>Note 2</p> </td> <td valign="top" width="143"> <p>ELECTRICAL POWER</p> </td> <td valign="top" width="100"> <p>AC BUS1</p> <p>DC BUS1</p> </td> </tr> <tr> <td valign="top" width="79"> <p>CHAN2</p> </td> <td valign="top" width="143"> <p>PITCH TRIM</p> </td> <td valign="top" width="143"> <p>CONTROL/POWER</p> <p>Note 2</p> </td> <td valign="top" width="143"> <p>ELECTRICAL POWER</p> </td> <td valign="top" width="100"> <p>AC ESS</p> <p>DC ESS</p> </td> </tr> </table> FLIGHT CONTROLS – SYSTEM LOADING Note 1: Same fragment path must not sever: ON-SIDE cables + OFF-SIDE hydraulic system + HYDRAULIC PWR #3 e.g.: Left elevator cable and HYDRAULIC PWR #2 and #3 or, Right elevator cable and HYDRAULIC PWR # 1 and # 3 Note 2: Same fragment path must not sever: — Both CHAN1 and CHAN2 circuits — ON-SIDE control circuit + OFF-SIDE power circuit — OFF-SIDE control circuit + ON-SIDE power circuit EXAMPLE – SYSTEM LOADING MATRIX FIGURE 2  TRI-SECTOR ROTOR BURST FIGURE 3 ![Aviation.Bot AI suggestion, not from EASA source: A diagram illustrating the typical layout and spatial arrangement of critical aircraft systems and components within the rotor plane cross-section of an aircraft fuselage. Detailed Description: The image displays a large, thick black outline of a circular shape, representing an aircraft fuselage cross-section. Inside this circular outline, various aircraft systems and components are depicted using points, lines, and shapes, each accompanied by a text label. At the top of the circular fuselage outline, two large, solid black circular dots are positioned symmetrically. The left dot is labeled "GEN 1", and the right dot is labeled "GEN 2". Below "GEN 1" and "GEN 2", two sets of text labels are positioned, with lines extending downwards to specific points within the fuselage: * On the left, the text "HYDRAULIC SYSTEM NO.1" is displayed, with "[PRESSURE, RETURN]" directly below it. A line connects this text to a point within the fuselage. * On the right, the text "HYDRAULIC SYSTEM NO.2" is displayed, with "[PRESS., RETURN, BRAKE 2]" directly below it. A line connects this text to a point within the fuselage. A prominent horizontal thick black line spans across the fuselage, positioned slightly above the center of the circular outline. From the right end of this horizontal line, a dashed line extends outwards to the right, labeled "WL73.5". Below this horizontal line, numerous smaller circular and rectangular shapes represent various components and lines, each with an associated text label connected by a line. On the left side, below the horizontal line: * Two small, hollow white rectangular shapes are positioned side-by-side. Lines point to them from the labels "RUDDER LH 2X" and "ELEVATOR LH 2X". * Below these rectangles, two small, hollow white circular dots are positioned. Lines point to them from the labels "MOTIVE FLOW" and "FUEL FEED". In the central-lower part of the fuselage: * Two small, hollow white circular dots are positioned centrally, with lines pointing to them from the label "APU FUEL PRESS+RETURN". * A larger, hollow white circular dot is labeled "BLEED AIR 14TH". * Two solid black circular dots are present, labeled "HYD PUMP 1B" (on the left) and "HYD PUMP 2B" (on the right). * Below "HYD PUMP 1B", a solid black circular dot is labeled "APU GEN 3". * To the left of "HYD PUMP 1B", a solid black circular dot is labeled "H-STAB TRIM". * Below "APU GEN 3", the text "HYDRAULIC SYSTEM NO.3" with "PRESSURE + RETURN" below it, has a line pointing to a small, hollow white circular dot. On the right side, below the horizontal line: * Two small, hollow white rectangular shapes are positioned side-by-side. Lines point to them from the labels "RUDDER RH 2X" and "ELEVATOR RH 2X". * Below these rectangles, two small, hollow white circular dots are positioned. Lines point to them from the labels "MOTIVE FLOW" and "FUEL FEED". * To the right of "HYD PUMP 2B", a solid black circular dot is labeled "H-STAB TRIM CH1". * Further to the right and lower, two small, hollow white circular dots are positioned. Lines point to them from the labels "TAIL TANK" and "TRANSFER +" and "REFUEL/DEFUEL". The lines connecting the text labels to the components indicate the association of the labels with specific points or areas within the fuselage cross-section. The different shapes (solid black circles, hollow white circles, hollow white rectangles) visually differentiate types of components or systems. Contextual Linkage: The diagram visually represents the spatial arrangement of critical aircraft systems and components within the rotor plane of an aircraft fuselage. It depicts the location of generators (GEN 1, GEN 2), three distinct hydraulic systems (No. 1, 2, and 3), flight control components (rudder, elevator, horizontal stabilizer trim), fuel system elements (fuel feed lines, APU fuel lines, tail tank connections), bleed air ducts, and hydraulic pumps. The "WL73.5" indicates a specific waterline reference for this cross-section. The "2X" notation for rudder and elevator components (e.g., "RUDDER LH 2X") suggests the presence of multiple instances or redundancy of these components in the depicted location. The labels like "[PRESSURE, RETURN]" for hydraulic systems specify the functional nature of the depicted lines.](file_tNNDI2wQkpg/image063.png) TYPICAL LAYOUT OF SYSTEMS IN ROTOR PLANE FIGURE 4  TRAJECTORY RANGE PLOTTING FIGURE 5  TYPICAL TRAJECTORY PLOTTING FIGURE 6  DEFINITION - THREAT WINDOW FIGURE 7 
Appendix 1 to AMC 20-128A User’s Manual ED Decision 2003/12/RM RISK ANALYSIS METHODOLOGY for UNCONTAINED ENGINE/APU FAILURE INDEX 1.0 GENERAL 2.0 SCOPE 3.0 FUNDAMENTAL COMPONENTS OF A SAFETY AND RISK ANALYSIS 4.0 ASSUMPTIONS 5.0 PLOTTING 6.0 METHODOLOGY – PROBABILITY ASSESSMENT 7.0 RESULTS ASSESSMENT <table border="0" cellpadding="0" cellspacing="0" width="591"> <tr> <td valign="top" width="72"> <p>FIGURE 1</p> </td> <td valign="top" width="519"> <p>EXAMPLE – HAZARD TREE</p> </td> </tr> <tr> <td valign="top" width="72"> <p>FIGURE 2</p> </td> <td valign="top" width="519"> <p>EXAMPLE – SYSTEM LOADING MATRIX</p> </td> </tr> <tr> <td valign="top" width="72"> <p>FIGURE 3</p> </td> <td valign="top" width="519"> <p>TRI-SECTOR ROTOR BURST</p> </td> </tr> <tr> <td valign="top" width="72"> <p>FIGURE 4</p> </td> <td valign="top" width="519"> <p>TYPICAL LAYOUT OF SYSTEMS IN ROTOR PLANE</p> </td> </tr> <tr> <td valign="top" width="72"> <p>FIGURE 5</p> </td> <td valign="top" width="519"> <p>TRAJECTORY RANGE PLOTTING</p> </td> </tr> <tr> <td valign="top" width="72"> <p>FIGURE 6</p> </td> <td valign="top" width="519"> <p>TYPICAL TRAJECTORY PLOTTING</p> </td> </tr> <tr> <td valign="top" width="72"> <p>FIGURE 7</p> </td> <td valign="top" width="519"> <p>DEFINITION – THREAT WINDOW</p> </td> </tr> <tr> <td valign="top" width="72"> <p>FIGURE 8</p> </td> <td valign="top" width="519"> <p>SAMPLE ROTOR STAGE PLOTTING CHART</p> </td> </tr> </table> 1.0 GENERAL 1.1 The design of aeroplane and engine systems and the location of the engines relative to critical systems and structure have a significant impact on survivability of the aeroplane following an uncontained engine failure. CS 23.903(b)(1) and 25.903(d)(1) of the EASA Certification Specifications (CS) require that design precautions be taken to minimise the hazard to the aeroplane due to uncontained failures of engine or auxiliary power unit (APU). [AMC 20-128A](#_DxCrossRefBm421436885) provides guidance for demonstrating compliance with these requirements. 1.2 As a part of this compliance demonstration, it is necessary to quantitatively assess the risk of a catastrophic failure in the event of an uncontained engine failure. This User’s Manual describes an acceptable method for this purpose. 1.3 The objective of the risk analysis is to measure the remaining risk after prudent and practical design considerations have been taken. Since each aeroplane would have unique features which must be considered when applying the methods described in this manual, there should be some flexibility in the methods and procedures. 1.4 It is a preferred approach to use these methods throughout the development of an aeroplane design to identify problem areas at an early stage when appropriate design changes are least disruptive. It is also advisable to involve the European Aviation Safety Agency (EASA) in this process at an early stage when appropriate interpretation of the methodology and documentation requirements can be established. 1.5 It should be noted that although the risk analysis produces quantitative results, subjective assessments are inherent in the methods of the analysis regarding the criticality of specific types of aeroplane component failures. Assumptions for such assessments should be documented along with the numerical results. 1.6 Aeroplane manufacturers have each developed their own method of assessing the effects of rotor failure, as there are many ways to get to the same result. This User’s Manual identifies all the elements that should be contained in an analysis, so that it can be interpreted by a person not familiar with such a process. 1.7 The intent of this manual therefore is to aid in establishing how an analysis is prepared, without precluding any technological advances or existing proprietary processes. 1.8 AMC 20-128A makes allowance for the broad configuration of the aeroplane as such damage to the structure due to rotor failure generally allows for little flexibility in design. System lay-out within a rotor burst zone, however, can be optimized. 1.9 Damage to structure, which may involve stress analysis, generally can be analyzed separately, and later coordinated with simultaneous system effects. 1.10 For an analysis of the effects on systems due to a rotor failure the aeroplane must be evaluated as a whole; and a risk analysis must specifically highlight all critical cases identified which have any potential to result in a catastrophe. 1.11 Such an analysis can then be used to establish that reasonable precautions have been taken to minimise the hazards, and that the remaining hazards are an acceptable risk. 1.12 A safety and a risk analysis are interdependent, as the risk analysis must be based on the safety analysis. The safety analysis therefore is the starting point that identifies potential hazardous or catastrophic effects from a rotor failure and is the basic tool to minimise the hazard in accordance with the guidelines of [AMC 20-128A](#_DxCrossRefBm421436885). 1.13 The risk analysis subsequently assesses and quantifies the residual risk to the aeroplane. 2.0 SCOPE The following describes the scope of analyses required to assess the aeroplane risk levels against the criteria set forth in Paragraph 10 of [AMC 20-128A](#_DxCrossRefBm421436885). 2.1 Safety Analysis is required to identify the critical hazards that may be numerically analyzed (hazards remaining after all practical design precautions have been taken). Functional criticality will vary by aeroplane and may vary by flight phase. Thorough understanding of each aeroplane structure and system functions is required to establish the criticality relative to each fragment trajectory path of the theoretical failure. Assistance from experts within each discipline is typically required to assure accuracy of the analysis in such areas as effects of fuel tank penetration on leakage paths and ignition hazards, thrust level control (for loss of thrust assessment), structural capabilities (for fuselage impact assessment), aeroplane controllability (for control cables impact assessment), and fuel asymmetry. 2.2 Risk For each remaining critical hazard, the following assessments may be prepared using the engine/APU failure models as defined in Paragraph 9 of [AMC 20-128A](#_DxCrossRefBm421436885): a. Flight mean risk for single 1/3 disc fragment. b. Flight mean risk for single intermediate fragment. c. Flight mean risk for alternate model (when used as an alternate to the 1/3 disc fragment and intermediate fragment). d. Multiple 1/3 disc fragments for duplicated or multiplicated systems. e. Specific risk for single 1/3 disc fragment and single intermediate fragment. f. Specific risk for any single disc fragment that may result in catastrophic structural damage. The risk level criteria for each failure model are defined in Paragraph 10 of [AMC 20-128A](#_DxCrossRefBm421436885). 3.0 FUNDAMENTAL COMPONENTS OF A SAFETY AND RISK ANALYSIS 3.1 The logical steps for a complete analysis are: a. Establish at the design definition the functional hazards that can arise from the combined or concurrent failures of individual systems, including multiplicated systems and critical structure. b. Establish a Functional Hazard Tree (see Figure 1), or a System Matrix (see Figure 2) that identifies all system interdependencies and failure combinations that must be avoided (if possible) when locating equipment in the rotor burst impact area. In theory, if this is carried out to the maximum, no critical system hazards other than opposite engine or fuel line hits would exist. c. Establish the fragment trajectories and trajectory ranges both for translational and spread risk angles for each damage. Plot these on a chart or graph, and identify the trajectory ranges that could result in hazardous combinations (threats) as per the above system matrix or functional hazard analysis. d. Apply risk factors, such as phase of flight or other, to these threats, and calculate the risk for each threat for each rotor stage. e. Tabulate, summarize and average all cases. 3.2 In accordance with [AMC 20-128A](#_DxCrossRefBm421436885) the risk to the aeroplane due to uncontained rotor failure is assessed to the effects, once such a failure has occurred. The probability of occurrence of rotor failure, as analyzed with the probability methods of AMC 25.1309 (i.e. probability as a function of critical uncontained rotor failure rate and exposure time), does not apply. 3.3 The total risk level to the aeroplane, as identified by the risk analysis, is the mean value obtained by averaging the values of all rotor stages of all engines of the aeroplane, expressed as Flight Mean Risk. 4.0 ASSUMPTIONS 4.1 The following conservative assumptions, in addition to those in Paragraphs 10(a)(1), (2) and (3) of [AMC 20-128A](#_DxCrossRefBm421436885), have been made in some previous analyses. However, each aeroplane design may have unique characteristics and therefore a unique basis for the safety assessment leading to the possibility of different assumptions. All assumptions should be substantiated within the analysis: a. The 1/3 disc fragment as modeled in Paragraph 9(a) of the [AMC 20-128A](#_DxCrossRefBm421436885) travels along a trajectory path that is tangential to the sector centroid locus, in the direction of rotor rotation (Refer to Figure 3). The sector fragment rotates about its centroid without tumbling and sweeps a path equal to twice the greatest radius that can be struck from the sector centroid that intersects its periphery. The fragment is considered to possess infinite energy, and therefore to be capable of severing lines, wiring, cables and unprotected structure in its path, and to be undeflected from its original trajectory unless deflection shields are fitted. However, protective shielding or an engine being impacted may be assumed to have sufficient mass to stop even the most energetic fragment. b. The probability of release of debris within the maximum spread angle is uniformly distributed over all directions. c. The effects of severed electrical wiring are dependent on the configuration of the affected system. In general, severed wiring is assumed to not receive inadvertent positive voltage for any significant duration. d. Control cables that are struck by a fragment disconnect. e. Hydraulically actuated, cable driven control surfaces, which do not have designated “fail to” settings, tend to fail to null when control cables are severed. Subsequent surface float is progressive and predictable. f. Systems components are considered unserviceable if their envelope has been touched. In case of an engine being impacted, the nacelle structure may be regarded as engine envelope, unless damage is not likely to be hazardous. g. Uncontained events involving in-flight penetration of fuel tanks will not result in fuel tank explosion. h. Unpowered flight and off-airport landings, including ditching, may be assumed to be not catastrophic to the extent validated by accident statistics or other accepted factors. i. Damage to structure essential for completion of flight is catastrophic (Ref. [AMC 20-128A](#_DxCrossRefBm421436885), Paragraph 10.b(1)). j. The flight begins when engine power is advanced for takeoff and ends after landing when turning off the runway. 5.0 PLOTTING 5.1 Cross-section and plan view layouts of the aeroplane systems in the ranges of the rotor burst impact areas should be prepared, either as drawings, or as computer models These layouts should plot the precise location of the critical system components, including fuel and hydraulic lines, flight control cables, electric wiring harnesses and junction boxes, pneumatic and environmental system ducting, fire extinguishing; critical structure, etc. 5.2 For every rotor stage a plane is developed. Each of these planes contains a view of all the system components respective outer envelopes, which is then used to generate a cross-section. See Figure 4. 5.3 Models or drawings representing the various engine rotor stages and their fore and aft deviation are then generated. 5.4 The various trajectory paths generated for each engine rotor stage are then superimposed on the cross-section layouts of the station planes that are in the range of that potential rotor burst in order to study the effects (see Figure 5). Thus separate plots are generated for each engine rotor stage or rotor group. To reduce the amount of an analysis the engine rotor stages may also be considered as groups, as applicable for the engine type, using the largest rotor stage diameter of the group. 5.5 These trajectory paths may be generated as follows and as shown in Figure 6: a. Two tangent lines T1 are drawn between the locus of the centroid and the target envelope. b. At the tangent line touch points, lines N1 and N2 normal to the tangent lines, are drawn with the length equal to the radius of the fragment swept path (as also shown in Figure 1). c. Tangent lines T2 are drawn between the terminal point of the normal lines and the locus of the centroid. The angle between these two tangent lines is the translational risk angle. 5.6 The entry and exit angles are then calculated. 5.7 The initial angle of intersection and the final angle of intersection are recorded, and the trajectories in between are considered to be the range of trajectories in which this particular part would be impacted by a rotor sector, and destroyed (i.e. the impact area). The intersections thus recorded are then entered on charts in tabular form so that the simultaneous effects can be studied. Refer to Figure 8. Thus it will be seen that the total systems’ effects can be determined and the worst cases identified. 5.9 If a potentially serious multiple system damage case is identified, then a more detailed analysis of the trajectory range will be carried out by breaking the failure case down into the specific fore-aft spread angle, using the individual rotor stage width instead of combined groups, if applicable. 6.0 METHODOLOGY – PROBABILITY ASSESSMENT 6.1 Those rotor burst cases that have some potential of causing a catastrophe are evaluated in the analysis in an attempt to quantify an actual probability of a catastrophe, which will, in all cases, depend on the following factors: a. The location of the engine that is the origin of the fragment, and its direction of rotation. b. The location of critical systems and critical structure. c. The rotor stage and the fragment model. d. The translational trajectory of the rotor fragment, e. The specific spread angle range of the fragment. f. The specific phase of the flight at which the failure occurs. g. The specific risk factor associated with any particular loss of function. 6.2 Engine Location The analysis should address the effects on systems during one flight after a single rotor burst has occurred, with a probability of 1.0. As the cause may be any one of the engines, the risk from each engine is later averaged for the number of engines. The analysis trajectory charts will then clearly show that certain system damage is unique to rotor fragments from a particular engine due to the direction of rotation, or, that for similar system damage the trajectory range varies considerably between engines. A risk summary should table each engine case separately with the engine location included. 6.3 Rotor Element The probability of rotor failure is assumed to be 1.0 for each of all rotor stages. For the analysis the individual risk(s) from each rotor stage of the engine should be assessed and tabled. 6.4 Translational Risk Angle The number of degrees of included arc (out of 360) at which a fragment intersects the component/structure being analyzed. Refer to Figure 6 and Figure 7. 6.5 Trajectory Probability (P) The probability of a liberated rotor fragment leaving the engine case is equal over 360, thus the probability P of that fragment hitting a system component is the identified Translational Risk Angle ɸ in degrees °, divided by 360, i.e.  or ![Aviation.Bot AI suggestion, not from EASA source: \[\frac{\phi 1 - \phi 2}{360}\]](/static/files/file_wSyEACTCE2d/image048.png) 6.6 Spread Angle If the failure model of the analysis assumes a (fore and aft) spread of ± 5°, then the spread angle is a total of 10°. If a critical component can only be hit at a limited position within that spread, then the exposure of that critical component can then be factored according to the longitudinal position within the spread angle, e.g.: ![Aviation.Bot AI suggestion, not from EASA source: \[\frac{\psi 2 - \psi 1}{\textit{spread angle}}\]](/static/files/file_wSyEACTCE2d/image049.png) If a component can only be hit at the extreme forward range of +4° to +5°, then the factor is .1 (for one degree out of 10). 6.7 Threat Window The definition of a typical threat window is shown in Figure 7. 6.8 Phase of Flight Certain types of system damage may be catastrophic only during a specific portion of the flight profile, such as a strike on the opposite engine during take-off after V1 (i.e. a probability of 1.0), while with altitude a straight-ahead landing may be possible under certain favourable conditions (e.g. a probability of less than 1.0). The specific case can then be factored accordingly. 6.8.1 The most likely time for an uncontained rotor failure to occur is during take-off, when the engine is under highest stress. Using the industry accepted standards for the percentage of engine failures occurring within each flight phase, the following probabilities are assumed: <table border="1" cellpadding="0" cellspacing="0" width="491"> <tr> <td valign="top" width="245"> <p>Take-off before V1</p> </td> <td valign="top" width="245"> <p>35%</p> </td> </tr> <tr> <td valign="top" width="245"> <p>V1 to first power reduction</p> </td> <td valign="top" width="245"> <p>20%</p> </td> </tr> <tr> <td valign="top" width="245"> <p>Climb</p> </td> <td valign="top" width="245"> <p>22%</p> </td> </tr> <tr> <td valign="top" width="245"> <p>Cruise</p> </td> <td valign="top" width="245"> <p>14%</p> </td> </tr> <tr> <td valign="top" width="245"> <p>Descent</p> </td> <td valign="top" width="245"> <p>3%</p> </td> </tr> <tr> <td valign="top" width="245"> <p>Approach</p> </td> <td valign="top" width="245"> <p>2%</p> </td> </tr> <tr> <td valign="top" width="245"> <p>Landing/Reverse</p> </td> <td valign="top" width="245"> <p>4%</p> </td> </tr> </table> 6.8.2 The flight phase failure distribution above is used in the calculations of catastrophic risk for all cases where this risk varies with flight phase. 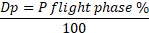 6.9 Other Risk Factors Risks such as fire, loss of pressurization, etc., are individually assessed for each case where applicable, using conservative engineering judgment. This may lead to a probability of catastrophe (i.e., risk factor) smaller than 1.0. 6.9.1 The above probabilities and factors are used in conjunction with the critical trajectory range defined to produce a probability of the specific event occurring from any random rotor burst. This value is then factored by the "risk" factor assessed for the case, to derive a calculated probability of catastrophe for each specific case. Typical conditional probability values for total loss of thrust causing catastrophic consequences are: <table border="1" cellpadding="0" cellspacing="0" width="489"> <tr> <td valign="top" width="264"> <p><b>Phase</b></p> </td> <td valign="top" width="112"> <p><b>Dp</b></p> </td> <td valign="top" width="112"> <p><b>Risk</b></p> </td> </tr> <tr> <td valign="top" width="264"> <p>T.O.–V1 to first power reduction</p> </td> <td valign="top" width="112"> <p>0.20</p> </td> <td valign="top" width="112"> <p>1.0</p> </td> </tr> <tr> <td valign="top" width="264"> <p>Climb</p> </td> <td valign="top" width="112"> <p>0.22</p> </td> <td valign="top" width="112"> <p>0.4</p> </td> </tr> <tr> <td valign="top" width="264"> <p>Cruise</p> </td> <td valign="top" width="112"> <p>0.14</p> </td> <td valign="top" width="112"> <p>0.2</p> </td> </tr> <tr> <td valign="top" width="264"> <p>Descent</p> </td> <td valign="top" width="112"> <p>0.03</p> </td> <td valign="top" width="112"> <p>0.4</p> </td> </tr> <tr> <td valign="top" width="264"> <p>Approach</p> </td> <td valign="top" width="112"> <p>0.02</p> </td> <td valign="top" width="112"> <p>0.4</p> </td> </tr> </table> 6.10 All individual case probabilities are then tabled and summarised. 6.11 The flight mean values are obtained by averaging those for all discs or rotor stages on all engines across a nominal flight profile. The following process may be used to calculate the flight mean value for each Failure Model: a. Establish from the table in Figure 8 the threat windows where, due to combination of individual damages, a catastrophic risk exists. b. For each stage case calculate the risk for all Critical Hazards c. For each stage case apply all risk factors, and, if applicable, factor for Flight Phase-Failure distribution d. For each engine, average all stages over the total number of engine stages e. For each aeroplane, average all engines over the number of engines. 7.0 RESULTS ASSESSMENT 7.1 An applicant may show compliance with CS 23.903(b)(1) and CS 25.903(d)(1) using guidelines set forth in [AMC 20-128A](#_DxCrossRefBm421436885). The criteria contained in the AMC may be used to show that: a. Practical design precautions have been taken to minimise the damage that can be caused by uncontained engine debris, and b. Acceptable risk levels, as specified in [AMC 20-128A](#_DxCrossRefBm421436885), Paragraph 10, have been achieved for each critical Failure Model. 7.2 The summary of the applicable risk level criteria is shown in Table 1 below. Table 1 Summary of Acceptable Risk Level Criteria <table border="1" cellpadding="0" cellspacing="0" width="533"> <tr> <td valign="top" width="291"> <p><b>Requirement</b></p> </td> <td valign="top" width="242"> <p><b>Criteria</b></p> </td> </tr> <tr> <td valign="top" width="291"> <p>Average 1/3 Disc Fragment</p> </td> <td valign="top" width="242"> <p>1 in 20</p> </td> </tr> <tr> <td valign="top" width="291"> <p>Average Intermediate Fragment</p> </td> <td valign="top" width="242"> <p>1 in 40</p> </td> </tr> <tr> <td valign="top" width="291"> <p>Average Alternate Model</p> </td> <td valign="top" width="242"> <p>1 in 20 @ ± 5 degree Spread Angle</p> </td> </tr> <tr> <td valign="top" width="291"> <p>Multiple Disc Fragments</p> </td> <td valign="top" width="242"> <p>1 in 10</p> </td> </tr> <tr> <td valign="top" width="291"> <p>Any single fragment (except for structural damage)</p> </td> <td valign="top" width="242"> <p>2 x corresponding average criterion</p> </td> </tr> </table>  EXAMPLE – HAZARD TREE FIGURE 1 <table border="1" cellpadding="0" cellspacing="0" width="608"> <tr> <td valign="top" width="79"> <p><b>LOC</b></p> </td> <td valign="top" width="143"> <p><b>COMPONENT</b></p> </td> <td valign="top" width="143"> <p><b>DAMAGE TO</b></p> </td> <td valign="top" width="143"> <p><b>SYSTEM LOADED</b></p> </td> <td valign="top" width="100"> <p><b>DETAIL</b></p> </td> </tr> <tr> <td valign="top" width="79"> <p>LEFT</p> </td> <td valign="top" width="143"> <p>AILERON</p> </td> <td valign="top" width="143"> <p>CABLES/SURFACE</p> </td> <td valign="top" width="143"> <p>HYDRAULIC POWER</p> </td> <td valign="top" width="100"> <p>#1 & #3</p> </td> </tr> <tr> <td valign="top" width="79"> <p>RIGHT</p> </td> <td valign="top" width="143"> <p>AILERON</p> </td> <td valign="top" width="143"> <p>CABLES/SURFACE</p> </td> <td valign="top" width="143"> <p>HYDRAULIC POWER</p> </td> <td valign="top" width="100"> <p>#2 & #3</p> </td> </tr> <tr> <td valign="top" width="79"> <p>LEFT</p> </td> <td valign="top" width="143"> <p>SPOILER - OUTBD MULTI-FUNCTION</p> </td> <td valign="top" width="143"> <p>CONTROL/SURFACE</p> </td> <td valign="top" width="143"> <p>HYDRAULIC POWER</p> </td> <td valign="top" width="100"> <p>#1</p> </td> </tr> <tr> <td valign="top" width="79"> <p>RIGHT</p> </td> <td valign="top" width="143"> <p>SPOILER - OUTBD MULTI-FUNCTION</p> </td> <td valign="top" width="143"> <p>CONTROL/SURFACE</p> </td> <td valign="top" width="143"> <p>HYDRAULIC POWER</p> </td> <td valign="top" width="100"> <p>#1</p> </td> </tr> <tr> <td valign="top" width="79"> <p>LEFT</p> </td> <td valign="top" width="143"> <p>FLAP-OUTBD</p> </td> <td valign="top" width="143"> <p>TRACK/SURFACE</p> </td> <td valign="top" width="143"> <p>ELECTRICAL POWER</p> </td> <td valign="top" width="100"> <p>AC BUS1</p> <p>AC ESS</p> </td> </tr> <tr> <td valign="top" width="79"> <p>RIGHT</p> </td> <td valign="top" width="143"> <p>FLAP-OUTBD</p> </td> <td valign="top" width="143"> <p>TRACK/SURFACE</p> </td> <td valign="top" width="143"> <p>ELECTRICAL POWER</p> </td> <td valign="top" width="100"> <p>AC BUS1</p> <p>AC ESS</p> </td> </tr> <tr> <td valign="top" width="79"> <p>LEFT</p> </td> <td valign="top" width="143"> <p>RUDDER</p> </td> <td valign="top" width="143"> <p>CABLE</p> </td> <td valign="top" width="143"> <p>HYDRAULIC POWER</p> </td> <td valign="top" width="100"> <p>#1,#2&#3</p> </td> </tr> <tr> <td valign="top" width="79"> <p>RIGHT</p> </td> <td valign="top" width="143"> <p>RUDDER</p> </td> <td valign="top" width="143"> <p>CABLE</p> </td> <td valign="top" width="143"> <p>HYDRAULIC POWER</p> </td> <td valign="top" width="100"> <p>#1,#2&#3</p> </td> </tr> <tr> <td valign="top" width="79"> <p>LEFT</p> </td> <td valign="top" width="143"> <p>ELEVATOR</p> </td> <td valign="top" width="143"> <p>CABLES</p> <p>Note 1</p> </td> <td valign="top" width="143"> <p>HYDRAULIC POWER</p> </td> <td valign="top" width="100"> <p>#1 & #3</p> </td> </tr> <tr> <td valign="top" width="79"> <p>RIGHT</p> </td> <td valign="top" width="143"> <p>ELEVATOR</p> </td> <td valign="top" width="143"> <p>CABLES</p> <p>Note 1</p> </td> <td valign="top" width="143"> <p>HYDRAULIC POWER</p> </td> <td valign="top" width="100"> <p>#2 & #3</p> </td> </tr> <tr> <td valign="top" width="79"> <p>CHAN1</p> </td> <td valign="top" width="143"> <p>PITCH TRIM</p> </td> <td valign="top" width="143"> <p>CONTROL/POWER</p> <p>Note 2</p> </td> <td valign="top" width="143"> <p>ELECTRICAL POWER</p> </td> <td valign="top" width="100"> <p>AC BUS1</p> <p>DC BUS1</p> </td> </tr> <tr> <td valign="top" width="79"> <p>CHAN2</p> </td> <td valign="top" width="143"> <p>PITCH TRIM</p> </td> <td valign="top" width="143"> <p>CONTROL/POWER</p> <p>Note 2</p> </td> <td valign="top" width="143"> <p>ELECTRICAL POWER</p> </td> <td valign="top" width="100"> <p>AC ESS</p> <p>DC ESS</p> </td> </tr> </table> FLIGHT CONTROLS – SYSTEM LOADING Note 1: Same fragment path must not sever: ON-SIDE cables + OFF-SIDE hydraulic system + HYDRAULIC PWR #3 e.g.: Left elevator cable and HYDRAULIC PWR #2 and #3 or, Right elevator cable and HYDRAULIC PWR # 1 and # 3 Note 2: Same fragment path must not sever: — Both CHAN1 and CHAN2 circuits — ON-SIDE control circuit + OFF-SIDE power circuit — OFF-SIDE control circuit + ON-SIDE power circuit EXAMPLE – SYSTEM LOADING MATRIX FIGURE 2  TRI-SECTOR ROTOR BURST FIGURE 3 ![Aviation.Bot AI suggestion, not from EASA source: The image displays a cross-sectional diagram illustrating the typical layout and spatial distribution of various aircraft systems, including hydraulic, fuel, bleed air, and electrical components, within the rotor plane of an engine or APU. Detailed Description: The image features a large, thick black circular outline representing an aircraft fuselage cross-section. A prominent thick black horizontal line divides the lower half of the circle, suggesting a structural deck or floor. A dashed horizontal line, labeled "WL73.5", is positioned slightly above this structural line on the right side, extending outwards from the fuselage outline. Various aircraft systems and components are depicted within this cross-section, connected to their respective labels by thin black lines: * **Top Section:** * A solid black circle in the upper-left quadrant is labeled "GEN 1". * A solid black circle in the upper-right quadrant is labeled "GEN 2". * Text "HYDRAULIC SYSTEM NO.1 [PRESSURE, RETURN]" is positioned in the upper-left, with a line pointing to a location within the upper-left quadrant. * Text "HYDRAULIC SYSTEM NO.2 [PRESS., RETURN, BRAKE 2]" is positioned in the upper-right, with a line pointing to a location within the upper-right quadrant. * **Mid-Section (near the horizontal structural line):** * On the left side, two small, empty rectangular boxes are positioned on the horizontal structural line. The left box is associated with "RUDDER LH 2X", and the right box with "ELEVATOR LH 2X". * Below these boxes, two small, empty circles are present. The left circle is associated with "MOTIVE FLOW", and the right circle with "FUEL FEED". * On the right side, two small, empty rectangular boxes are positioned on the horizontal structural line. The left box is associated with "RUDDER RH 2X", and the right box with "ELEVATOR RH 2X". * Below these boxes, two small, empty circles are present. The left circle is associated with "MOTIVE FLOW", and the right circle with "FUEL FEED". * Centrally, just below the horizontal structural line, two small, empty circles are associated with "APU FUEL PRESS+RETURN". * **Lower Section:** * A larger, empty circle is centrally located, labeled "BLEED AIR 14TH". * To the left of "BLEED AIR 14TH", a small, solid black circle is labeled "HYD PUMP 1B". * To the right of "BLEED AIR 14TH", a small, solid black circle is labeled "HYD PUMP 2B". * In the lower-left quadrant, a small, solid black circle is labeled "H-STAB TRIM". * Adjacent to "H-STAB TRIM", another small, solid black circle is labeled "APU FUEL NEG-G". * Further left and down, a small, solid black circle is labeled "APU GEN 3". * A small, empty circle in the lower-left is associated with "HYDRAULIC SYSTEM NO.3 PRESSURE + RETURN". * In the lower-right quadrant, a small, solid black circle is labeled "H-STAB TRIM CH1". * Below "H-STAB TRIM CH1", two small, empty circles are associated with "TAIL TANK TRANSFER + REFUEL/DEFUEL". * Numerous other small, unlabeled empty and solid black circles are distributed throughout the lower half of the fuselage cross-section. Contextual Linkage: This diagram visually represents the physical arrangement of critical aircraft systems within a specific cross-section, identified as the "TYPICAL LAYOUT OF SYSTEMS IN ROTOR PLANE" by the surrounding text. The depiction of components like hydraulic systems (No.1, No.2, No.3), fuel lines, flight control elements (Rudder, Elevator, H-Stab Trim), bleed air systems, and generators (GEN 1, GEN 2, APU GEN 3) illustrates their spatial relationships and potential vulnerability to events such as uncontained engine or APU failure. The "WL73.5" indicates a specific vertical reference point within the aircraft structure, crucial for precise component placement and damage assessment.](file_wSyEACTCE2d/image053.png) TYPICAL LAYOUT OF SYSTEMS IN ROTOR PLANE FIGURE 4  TRAJECTORY RANGE PLOTTING FIGURE 5  TYPICAL TRAJECTORY PLOTTING FIGURE 6  DEFINITION - THREAT WINDOW FIGURE 7 ![Aviation.Bot AI suggestion, not from EASA source: **Overall Summary:** This chart, titled "ENGINE ROTOR FAILURE - SYSTEM EFFECTS," illustrates the vulnerability of various aircraft systems and components to damage from an uncontained engine rotor failure, mapping specific impact types across a range of trajectory angles for a High-Pressure (H.P.) Turbine 1 on the right engine. **Detailed Description:** The image displays a grid-based chart with the main title "ENGINE ROTOR FAILURE - SYSTEM EFFECTS" centered at the top. Below this, to the left, are labels indicating the subject of the analysis: "ENGINE: RIGHT" and "COMPONENT: H.P. TURBINE 1", with "SIZE: In." next to "COMPONENT:". The chart is organized into several columns and rows: 1. **System Categories (Leftmost Column):** This column lists major aircraft system groups in bold text: "FLIGHT CONTROLS", "HYDRAULIC POWER", "FIRE PROTECTION", "FUEL", "ELECTRICAL POWER", "ENVIRONMENTAL", "POWER PLANT", and "APU". 2. **Components/Subsystems (Second Column):** This column details specific components or subsystems within each category. Examples include "RUDDER", "ELEVATOR", "H-STAB", "TRIM" (under FLIGHT CONTROLS); "POWER #1", "PLUMBING #1", "POWER #2", "PLUMBING #2", "PLUMBING #3" (under HYDRAULIC POWER); "ENGINE FIREX#1", "ENGINE FIREX#2", "APU FIREX" (under FIRE PROTECTION); "ENGINE FEED MOTIVE", "ENGINE FEED FLOW", "APU FEED", "TAIL TANK LINES" (under FUEL); "GENERATOR #1", "GENERATOR #2", "GENERATOR #3", "BATTERY MAIN", "BATTERY AUX" (under ELECTRICAL POWER); "CABIN PRES URE", "PNEUMATIC 10TH STAGE", "SUPPLY", "ACU", "OUTPUT", "ENGINE CON ROL" (under ENVIRONMENTAL); "OPPOSITE N CELLE" (under POWER PLANT); and "APU ENCLO URE" (under APU). 3. **Specific Elements/Channels (Third Column):** This column provides further detail for some components, such as "CABLES" for Rudder and Elevator, "CHANNEL# 2" for H-Stab, "CHANNEL# 1" for Trim, "A" or "B" for Hydraulic Power components, "L" or "R" for Engine Feed and Environmental components, and "REFUEL" or "TRANSFER" for Tail Tank Lines. 4. **IN/OUT Values (Fourth Column):** This column contains two sub-columns, "IN" and "OUT", listing three-digit numerical values (e.g., "244" IN, "252" OUT for Rudder Cables L). These values are associated with each specific component or element row. 5. **Trajectory Angles in Degrees (Main Grid):** The top row of the main grid is labeled "TRAJECTORY ANGLES IN DEGREES" and spans horizontally across the chart. It is subdivided into columns representing 5-degree or 10-degree increments, starting from "210" and extending to "315". The specific column headers are: "210", "215", "220", "225", "230", "235", "240", "245", "250", "255", "260", "265", "270", "275", "280", "285", "290", "295", "300", "305", "310", "315". The cells within the main grid are filled with distinct patterns to indicate the type of impact: * **Solid Black Rectangles:** Represent a "DIRECT HIT". * **"OOOOOO" pattern:** Represents an impact from the "OPPOSITE ENGINE FUEL LINE". * **"XXXXXX" pattern:** Represents an impact from the "OPPOSITE GENERATOR". * **"FFFFFF" pattern:** Represents an impact from the "APU FUEL LINE" (though no cells in the visible chart contain this pattern). **Legend:** A legend is provided at the bottom of the chart, explicitly defining the patterns: "LEGEND: [Solid Black Rectangle] = DIRECT HIT OOOOOO = OPPOSITE ENGINE FUEL LINE XXXXXX = OPPOSITE GENERATOR FFFFFF = APU FUEL LINE". **Figure Title:** The chart is identified as "FIGURE 8 - SAMPLE ROTOR STAGE PLOTTING CHART" below the legend. **Contextual Linkage:** This chart serves as a visual representation of "threat windows" for uncontained engine rotor failure, as referenced in the surrounding text (e.g., "Establish from the table in Figure 8 the threat windows where, due to combination of individual damages, a catastrophic risk exists."). It maps the angular vulnerability (trajectory angles) of specific aircraft systems and components to debris from an H.P. Turbine 1 failure on the right engine. The "IN" and "OUT" values likely define the angular extent or critical range of the component itself, while the patterns in the trajectory angle grid indicate the type of impact (direct or from specific opposite-side components) within those angular sectors.](file_wSyEACTCE2d/image057.png)