Light
Dark
System
Log In
Loading...
Compare / EASA/
Incorporated Amendments
/
Compare & Highlight Differences
GM1 MET.TR.215(e)(1) & (2) Forecasts and other information
Available versions for ERULES-1963177438-3458
ED Decision 2022/004/R
found in: ATM/ANS Provision of Services (2017/373) (Mar 2025)
From
ATM/ANS Provision ... (Mar 2025)
ATM/ANS Provision ... (Feb 2023)
From section
To
ATM/ANS Provision ... (Mar 2025)
ATM/ANS Provision ... (Feb 2023)
To section
No visible text changes
0 removals
0 additions
View
Rich
Plain
Sync scrolling
Share
From
Show details
Hide details
To
Show details
Hide details
Version
Show side by side
GM1 MET.TR.215(e)(1) & (2) Forecasts and other information ED Decision 2022/004/R MODEL CHARTS This guidance provides examples of model charts. (a) UPPER WIND AND TEMPERATURE CHART FOR STANDARD ISOBARIC SURFACE MODEL IS Example 1. Arrows, feathers and pennants (Mercator projection) 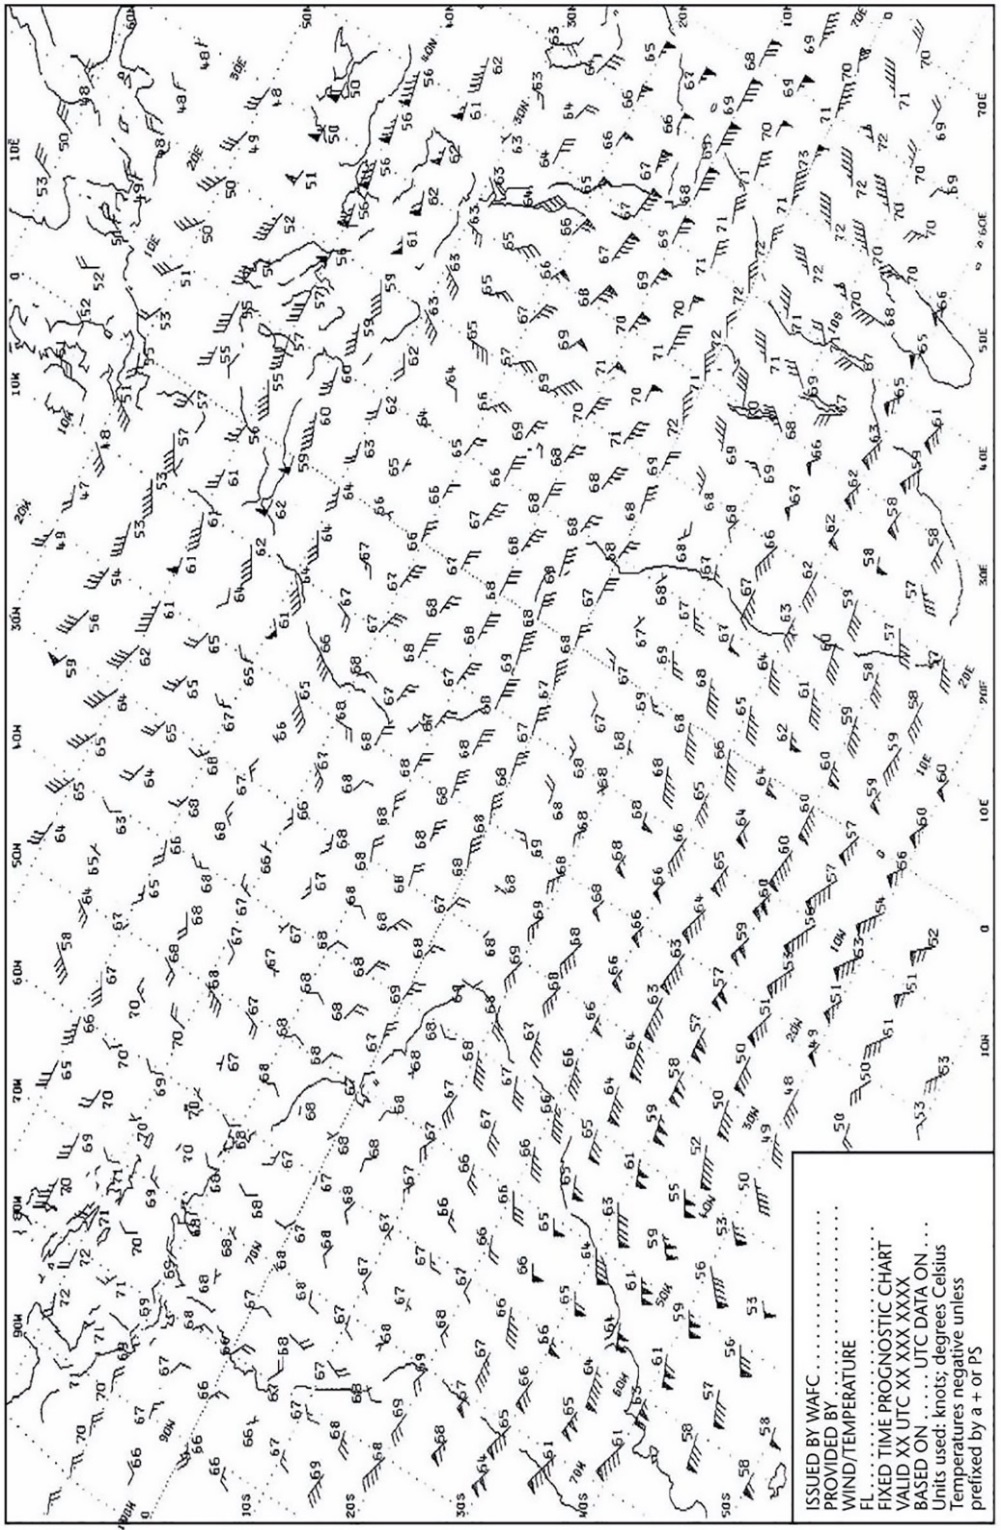 (b) UPPER WIND AND TEMPERATURE CHART FOR STANDARD ISOBARIC SURFACE MODEL IS Example 2. Arrows, feathers and pennants (Polar stereographic projection) 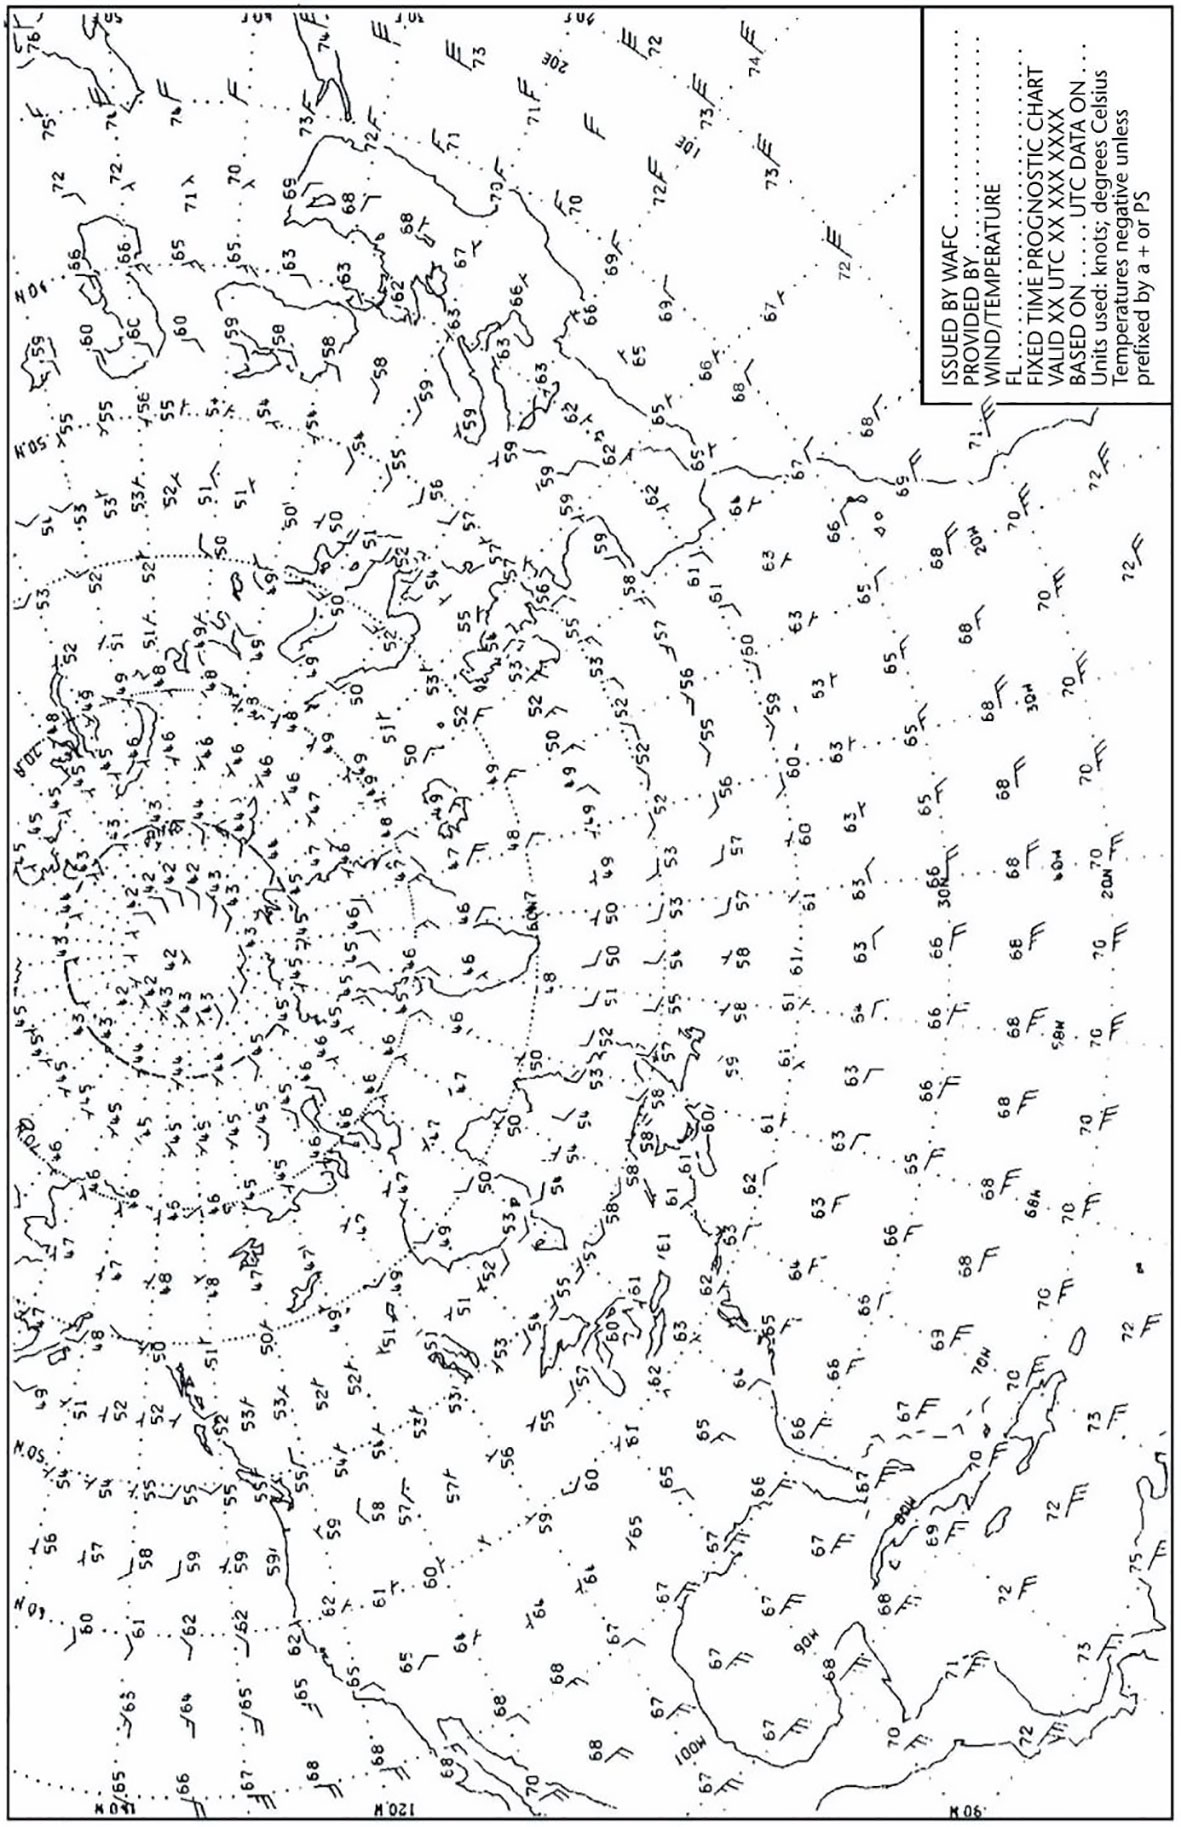 (c) SIGNIFICANT WEATHER CHART (HIGH LEVEL) MODEL SWH Example. Polar stereographic projection (showing the jet stream vertical extent) 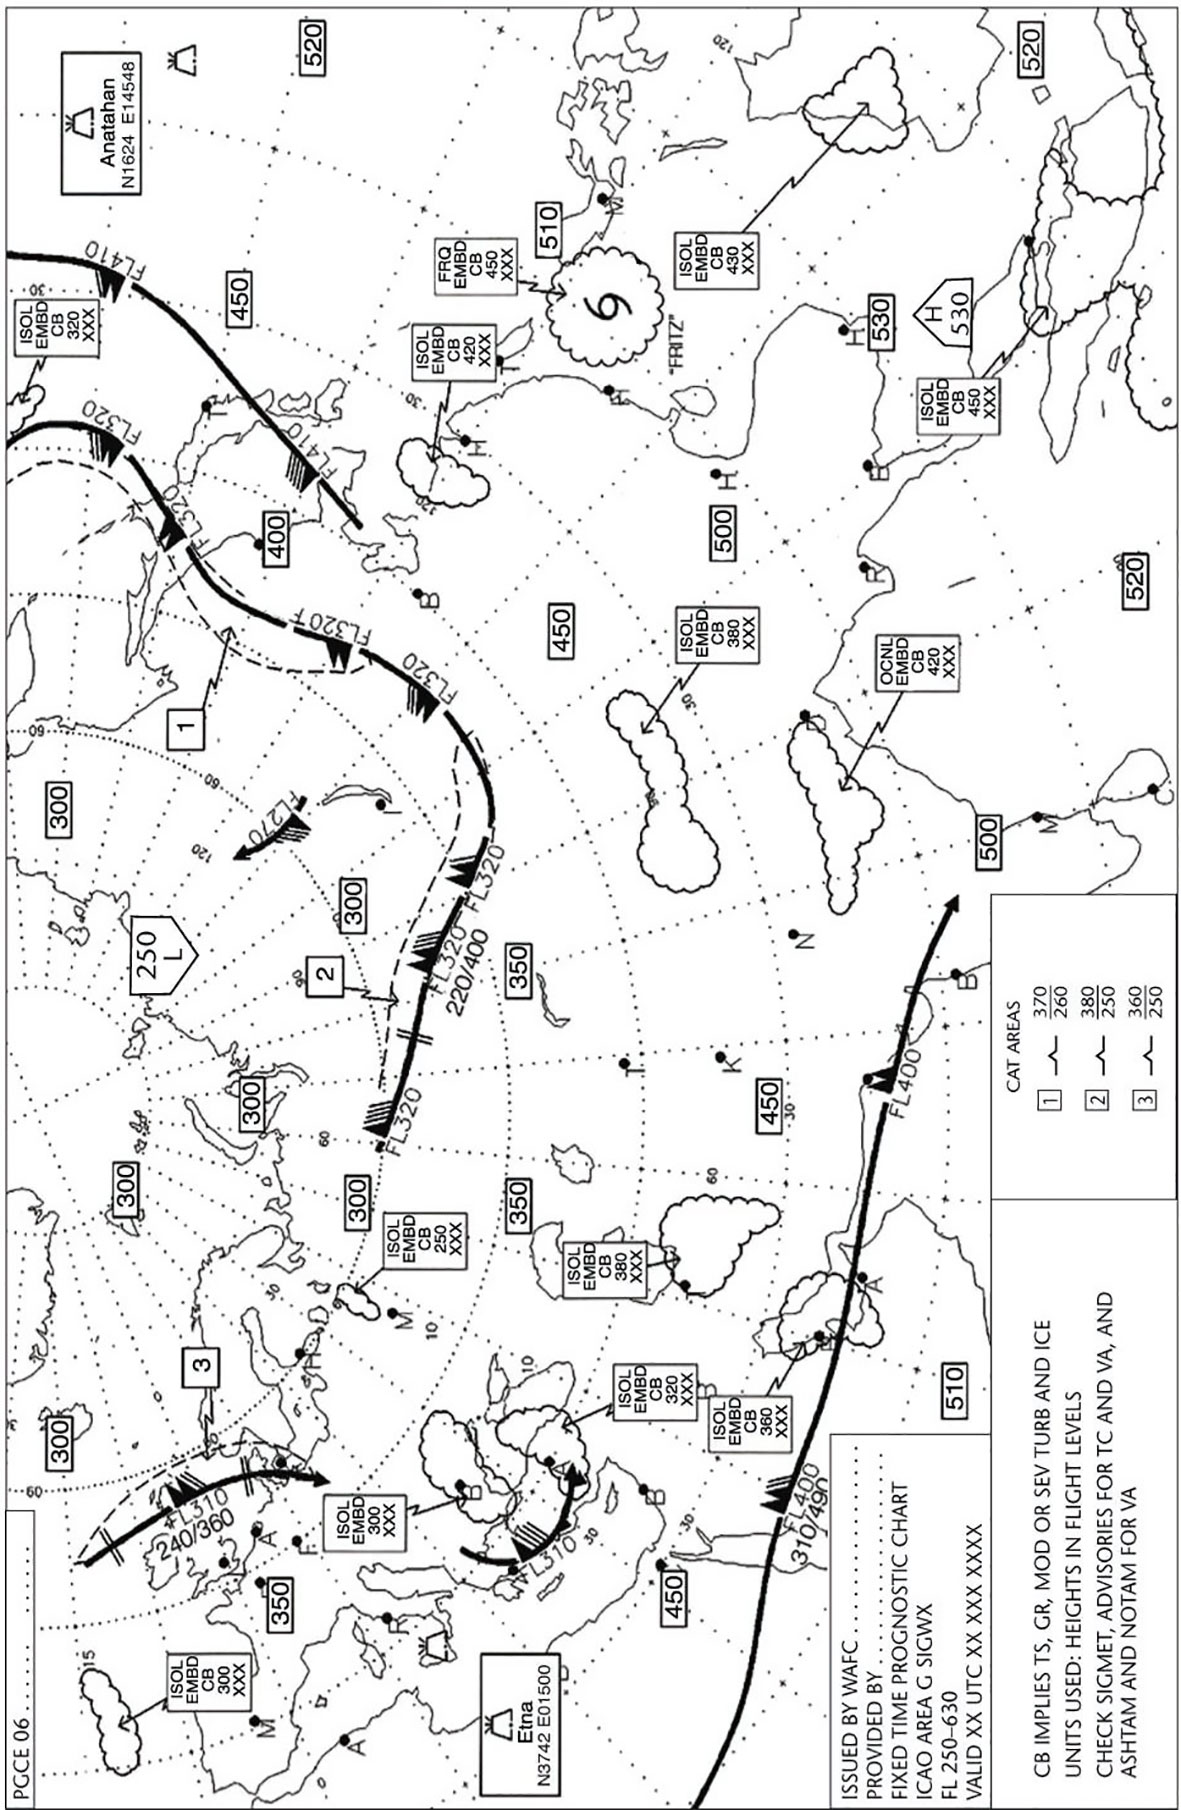 (d) SIGNIFICANT WEATHER CHART (MEDIUM LEVEL) MODEL SWM 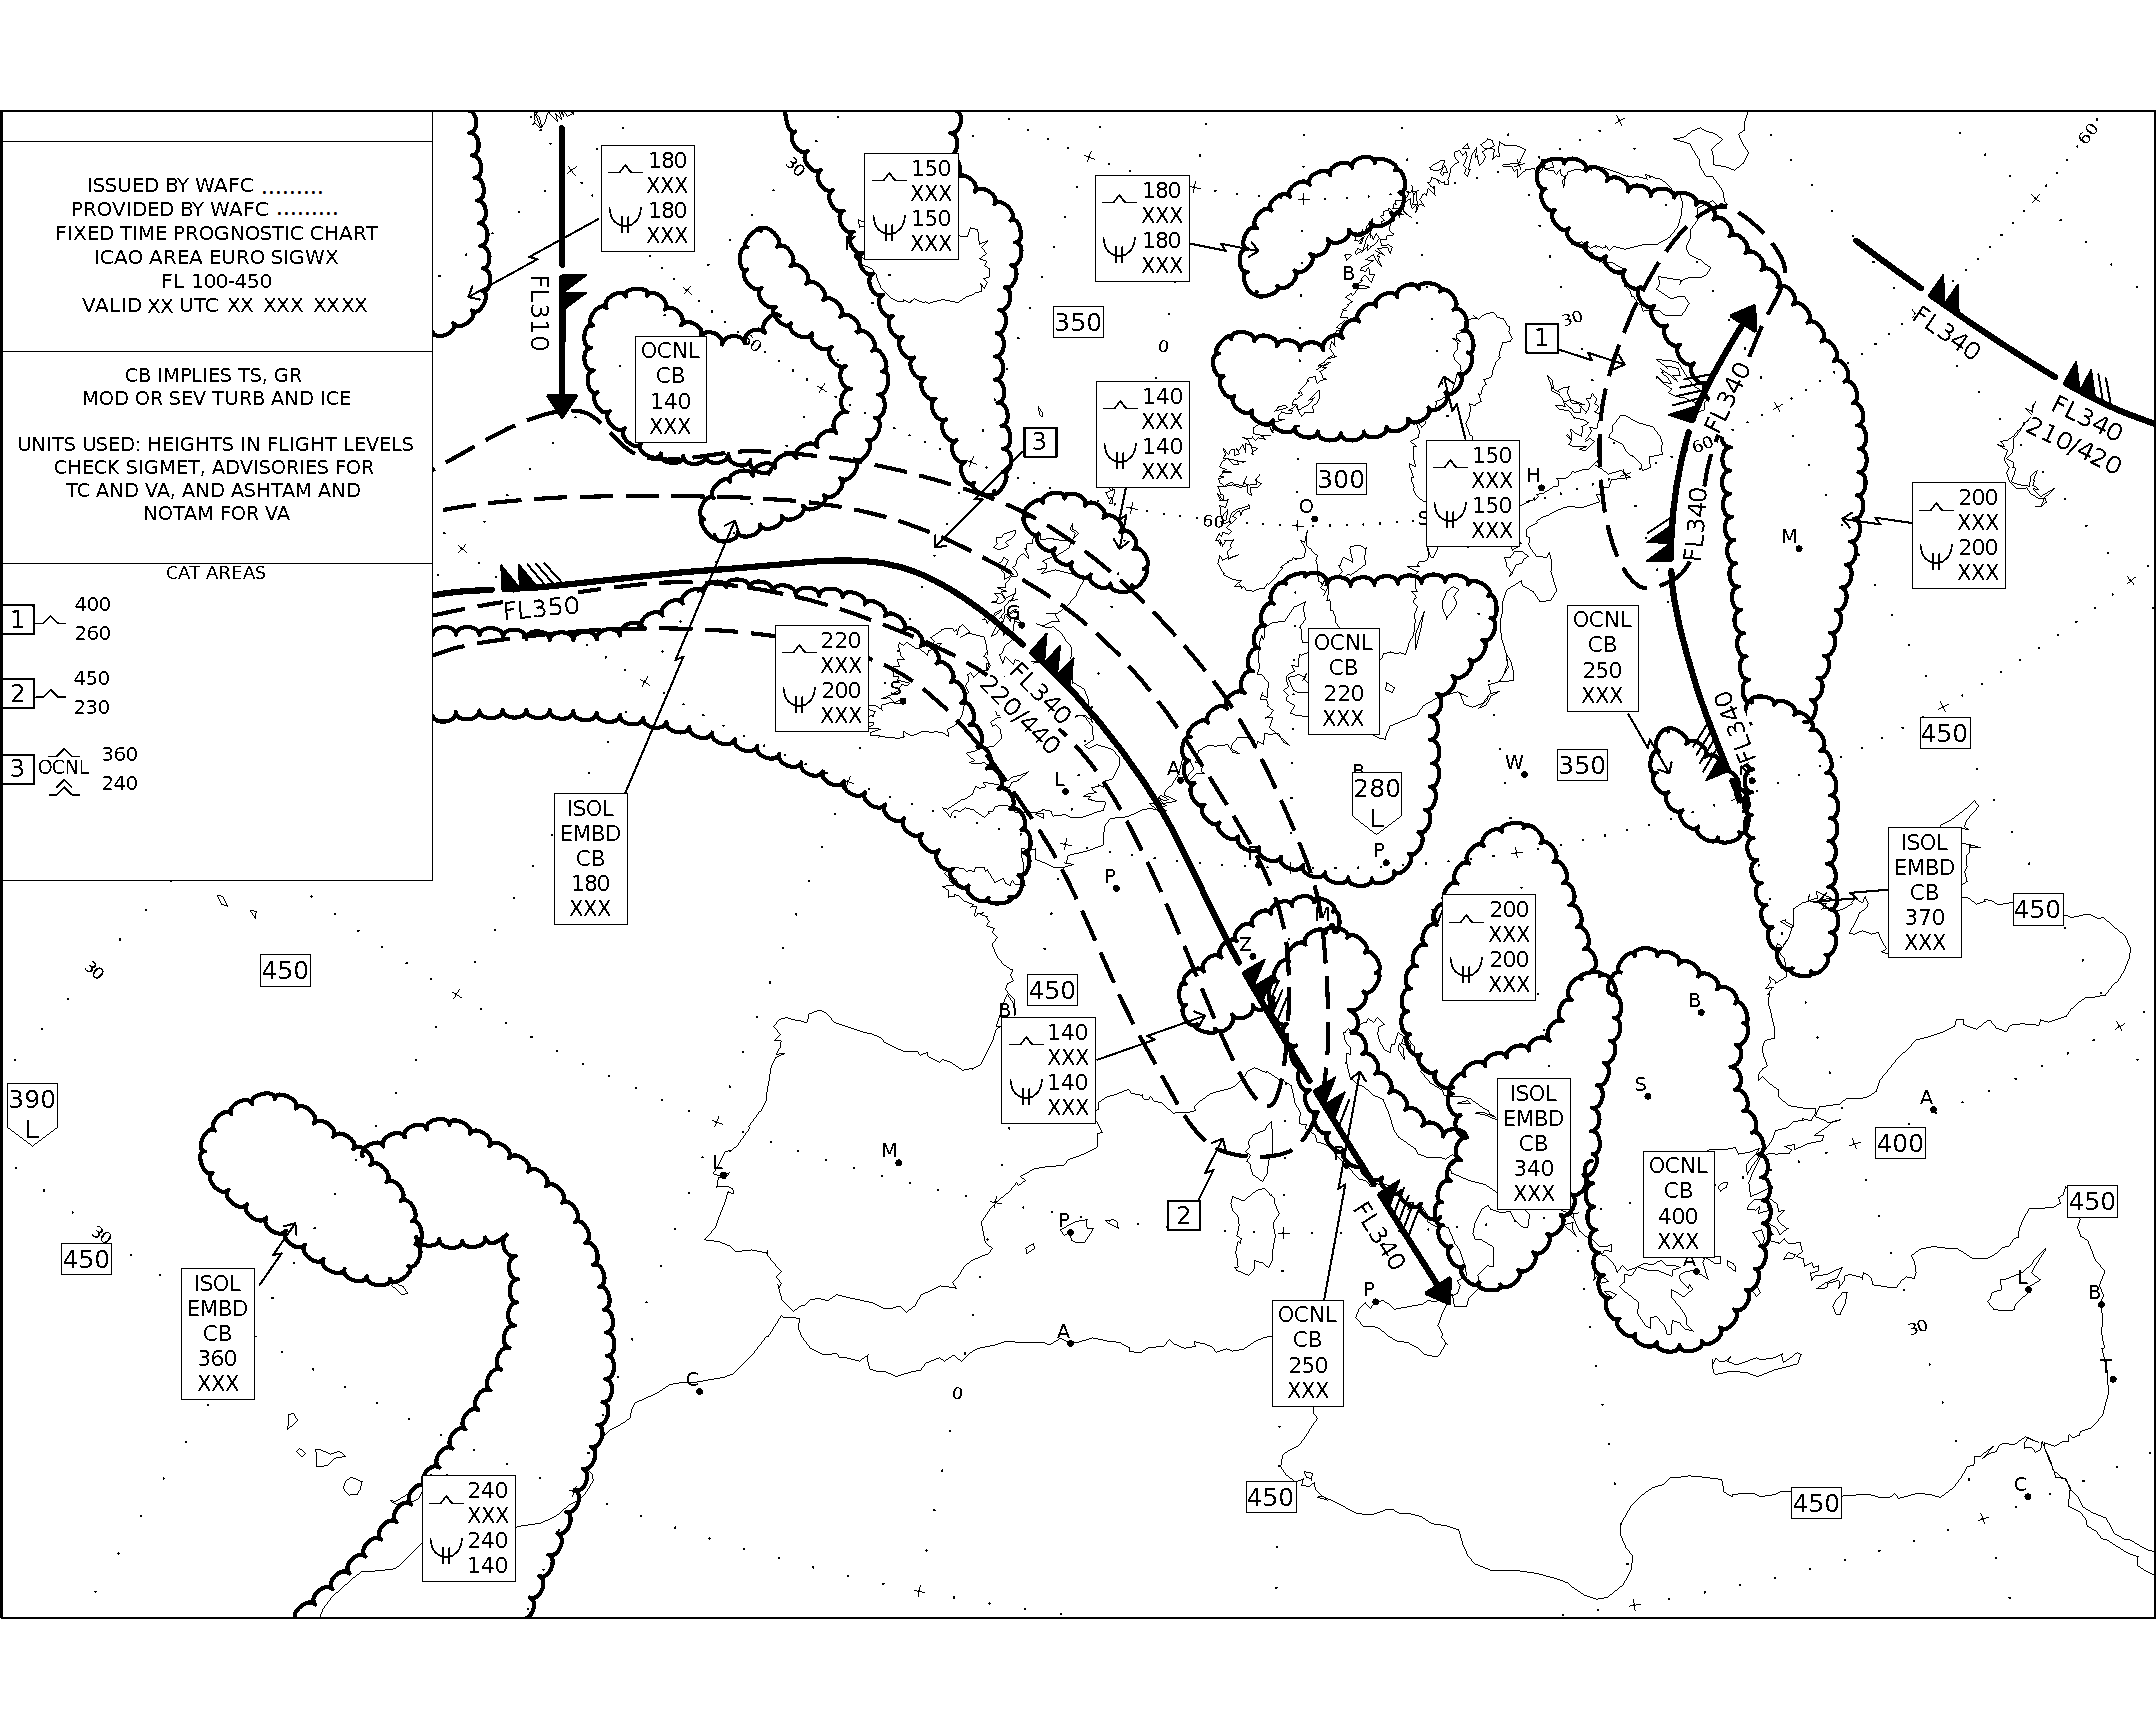 (e) SIGNIFICANT WEATHER CHART (LOW LEVEL) MODEL SWL Example 1 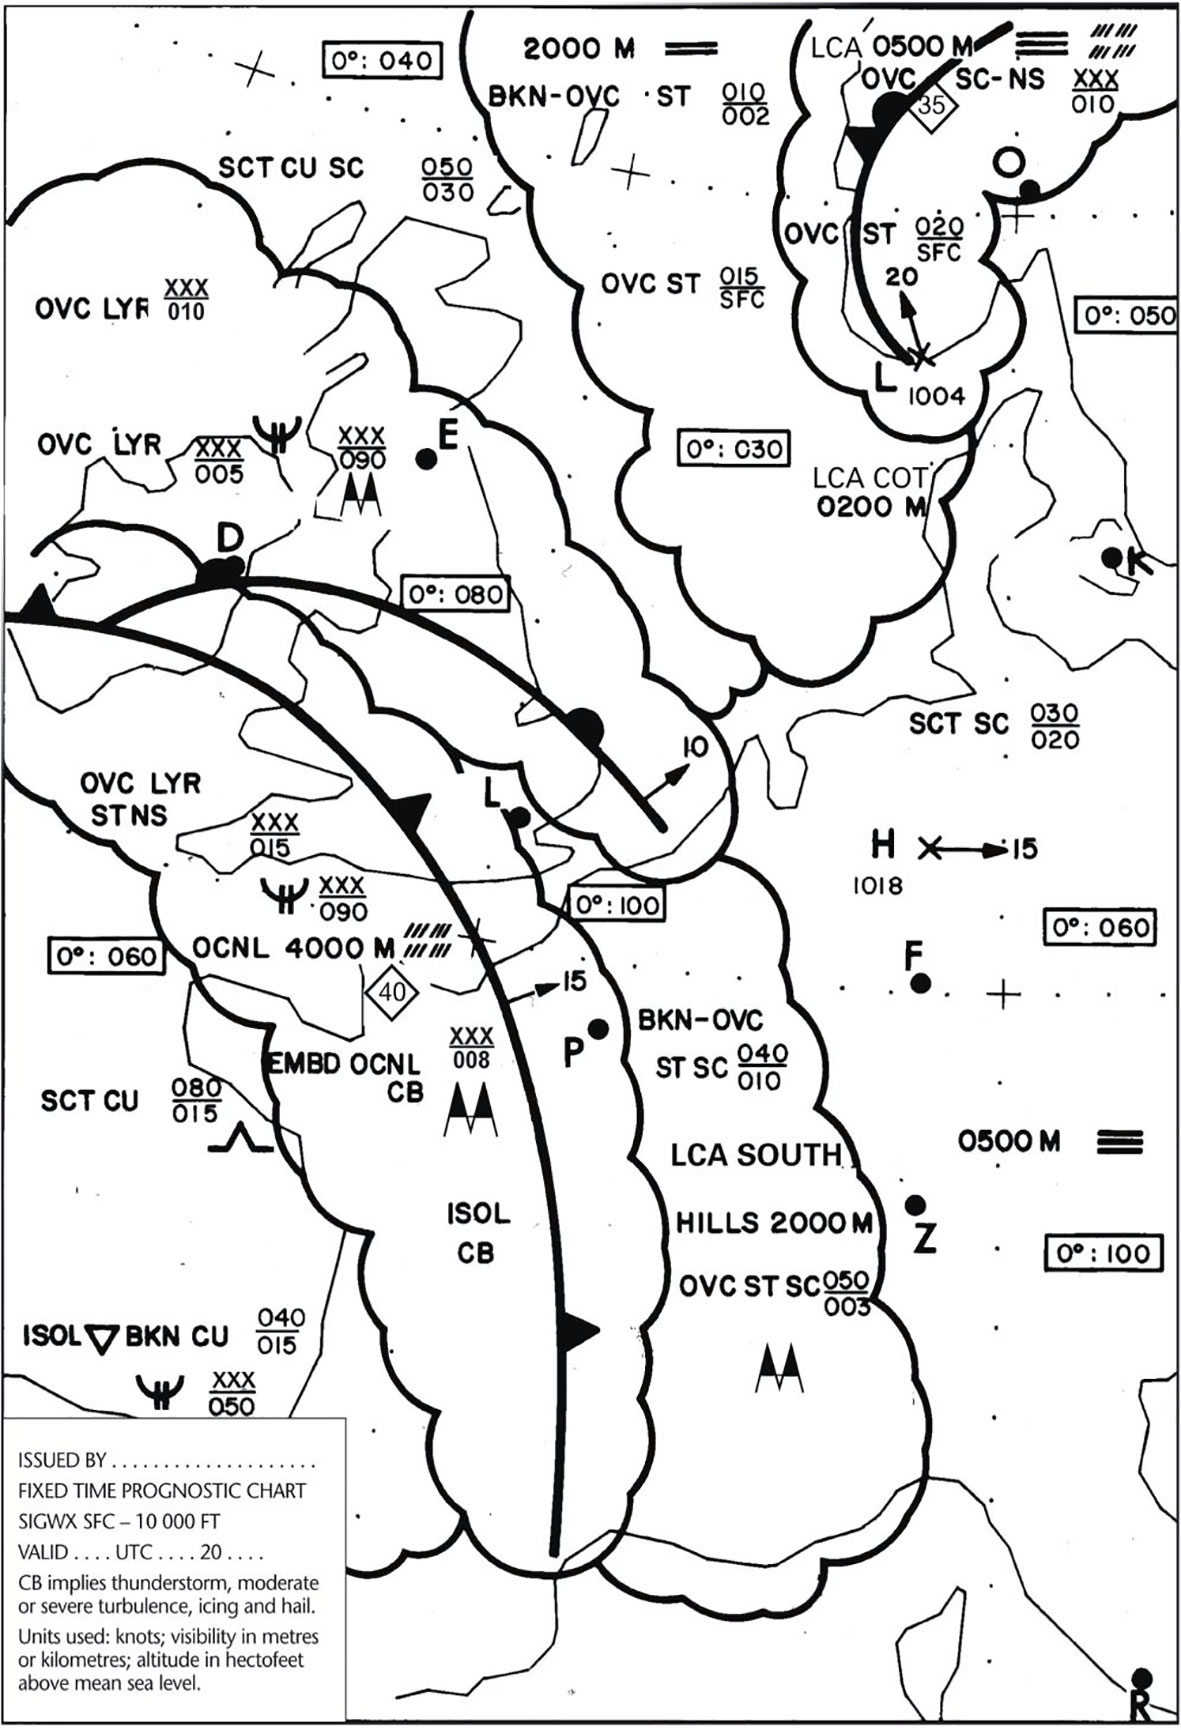 (f) SIGNIFICANT WEATHER CHART (LOW LEVEL) MODEL SWL Example 2 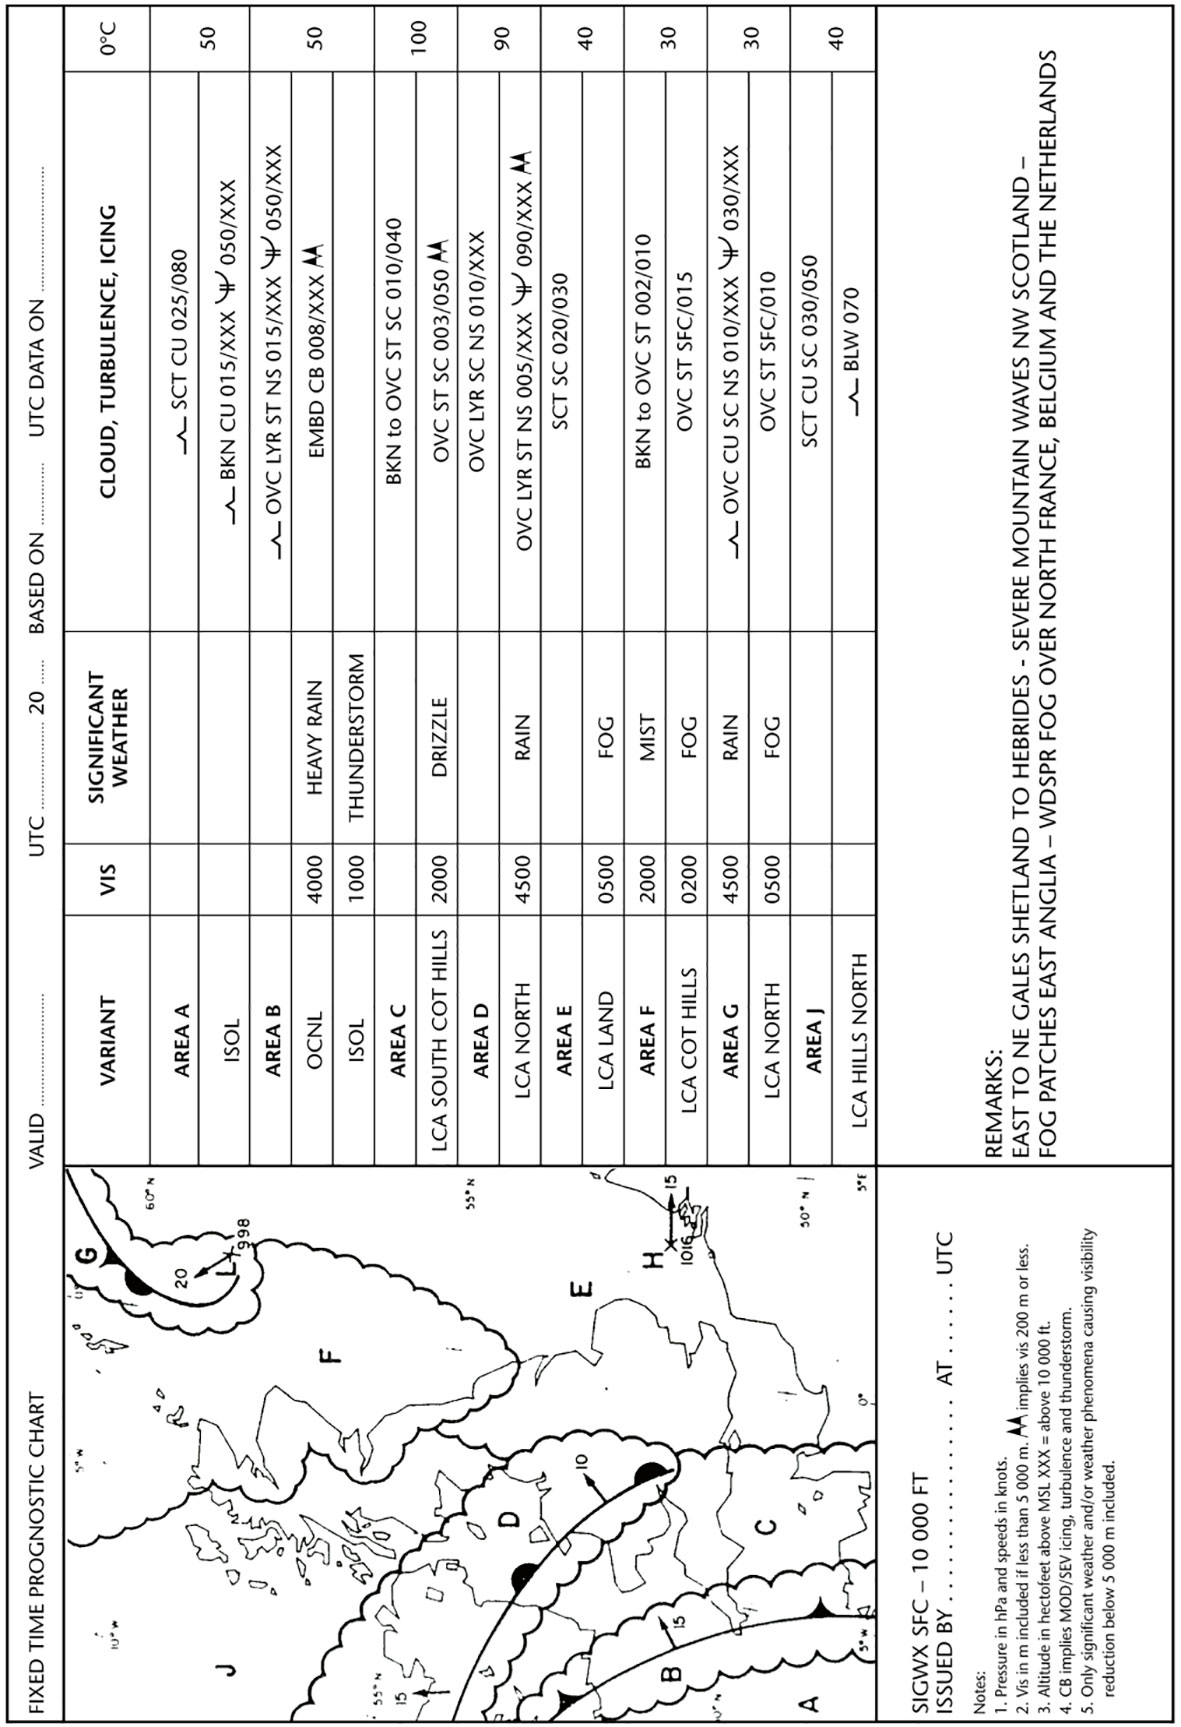
GM1 MET.TR.215(e)(1) & (2) Forecasts and other information ED Decision 2022/004/R MODEL CHARTS This guidance provides examples of model charts. (a) UPPER WIND AND TEMPERATURE CHART FOR STANDARD ISOBARIC SURFACE MODEL IS Example 1. Arrows, feathers and pennants (Mercator projection) ![Aviation.Bot AI suggestion, not from EASA source: [Image caption skipped for debugging]](/static/files/file_gqs63YSDadR/image078.jpg) (b) UPPER WIND AND TEMPERATURE CHART FOR STANDARD ISOBARIC SURFACE MODEL IS Example 2. Arrows, feathers and pennants (Polar stereographic projection) ![Aviation.Bot AI suggestion, not from EASA source: [Image caption skipped for debugging]](/static/files/file_gqs63YSDadR/image079.jpg) (c) SIGNIFICANT WEATHER CHART (HIGH LEVEL) MODEL SWH Example. Polar stereographic projection (showing the jet stream vertical extent) ![Aviation.Bot AI suggestion, not from EASA source: [Image caption skipped for debugging]](/static/files/file_gqs63YSDadR/image080.jpg) (d) SIGNIFICANT WEATHER CHART (MEDIUM LEVEL) MODEL SWM ![Aviation.Bot AI suggestion, not from EASA source: [Image caption skipped for debugging]](/static/files/file_gqs63YSDadR/image081.png) (e) SIGNIFICANT WEATHER CHART (LOW LEVEL) MODEL SWL Example 1 ![Aviation.Bot AI suggestion, not from EASA source: [Image caption skipped for debugging]](/static/files/file_gqs63YSDadR/image082.jpg) (f) SIGNIFICANT WEATHER CHART (LOW LEVEL) MODEL SWL Example 2 ![Aviation.Bot AI suggestion, not from EASA source: [Image caption skipped for debugging]](/static/files/file_gqs63YSDadR/image083.jpg)