ED Decision 2003/18/RM
(a) Primary flight controls and systems. Each primary flight control and system must be designed as follows:
(1) The flight control system and its supporting structure must be designed for loads corresponding to 125% of the computed hinge moments of the movable control surface in the conditions prescribed in paragraph A11 of this Appendix. in addition -
(i) The system limit loads need not exceed those that could be produced by the pilot and automatic devices operating the controls; and
(ii) The design must provide a rugged system for service use, including jamming, ground gusts, taxying downwind, control inertia, and friction.
(2) Acceptable maximum and minimum limit pilot forces for elevator, aileron, and rudder controls are shown in the table in CS-VLA 387(b). These pilots loads must be assumed to act at the appropriate control grips or pads as they would under flight conditions, and to be reacted at the attachments of the control system to the control surface horn.
(b) Dual controls. If there are dual controls, the systems must be designed for pilots operating in opposition, using individual pilot loads equal to 75% of those obtained in accordance with subparagraph (a) of this paragraph, except that individual pilot loads may not be less than the minimum limit pilot forces shown in the table in CS-VLA 397(b).
(c) Ground gust conditions. Ground gust conditions must meet the requirements of CS-VLA 415.
(d) Secondary controls and systems. Secondary controls and systems must meet the requirements of CS-VLA 405.
Table 1 – Limit flight load factors
|
LIMIT FLIGHT LOAD FACTORS |
|||||
|
Normal Category |
Utility category |
Aerobatic category |
|||
|
FLIGHT LOAD FACTORS |
Flaps Up |
n1 |
3.8 |
4.4 |
6.0 |
|
n2 |
–0.5 n1 |
||||
|
n3 |
Find n3 from Figure A1 |
||||
|
n4 |
Find n4 from Figure A2 |
||||
|
Flaps Down |
nflap |
0.5 n1 |
|||
|
nflap |
Zero* |
||||
*Vertical wing load may be assumed equal to zero and only the flap part of the wing need be checked for this condition.
Table 2 - Average limit control surface loading
|
AVERAGE LIMIT CONTROL SURFACE LOADING |
|||||
|
SURFACE |
DIRECTION OF LOADING |
MAGNITUDE OF LOADING |
CHORDWISE DISTRIBUTION |
||
|
HORIZONTAL TAIL I |
(a) |
Up and Down |
Figure A4 Curve (2) |
|
|
|
(b) |
Unsymmetrical loading and Down) |
100% 65% For aerobatic category see A11(c) |
|||
|
VERTICAL TAIL II |
(a) |
Right and Left |
Figure A4 Curve (1) |
Same as (A) above |
|
|
(b) |
Right and Left |
Figure A4 Curve (1) |
Same as (B) above |
||
|
AILERON III |
(a) |
Up and Down |
Figure A5 Curve (5) |
|
|
|
WING FLAP IV |
(a) |
Up |
Figure A5 Curve (4) |
|
|
|
(b) |
Down |
0·25 x Up load (a) |
|||
|
TRIM TAB V |
(a) |
Up and Down |
Figure A5 Curve (3) |
Same as (D) above |
|
|
Note: |
The surface loadings I, II, III an V above are based on speeds VAmin and VCmin. The loading of IV is based on VFmin. If values of speeds greater than these minimums are
selected for design, the appropriate surface loadings must be multiplied by
ratio |
||||
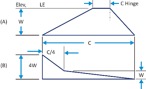

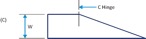
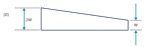


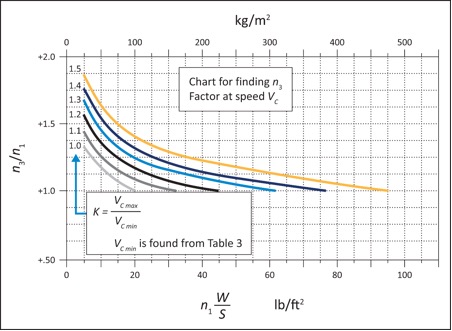
FIGURE A1
CHART FOR FINDING n3 FACTOR AT SPEED VC.
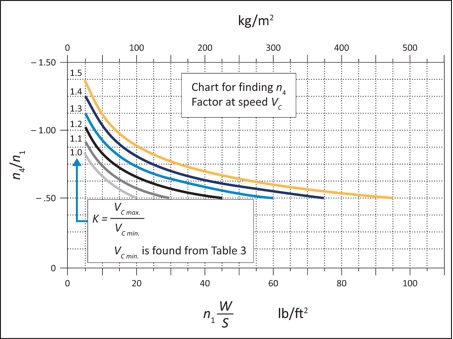
FIGURE A2
CHART FOR FINDING n4 FACTOR AT SPEED VC.
Table 3 - Determination of minimum design speeds – Equations
|
VDmin = 10·86 |
|
VCmin = 7·69 |
|
VAmin = 6·79 |
|
VFmin = 4·98 |


(Speeds are in knots, W in kg, S in m2)
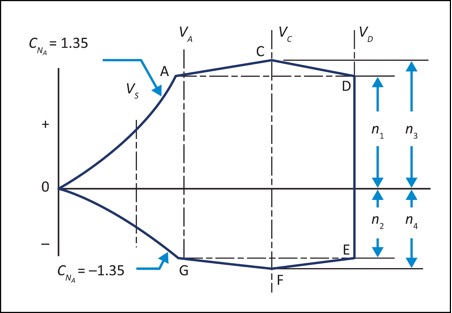
1. Conditions
‘C’ or ‘F’ need only be investigated when n3  or n4
or n4 is greater than n1 or n2 , respectively.
2. Condition ‘G’ need not be investigated when the supplementary condition specified in CS-VLA 369 is investigated.
FIGURE A3
FLIGHT ENVELOPE.
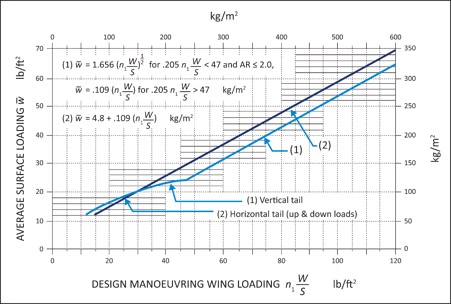
FIGURE A4
AVERAGE LIMIT CONTROL SURFACE LOADING.
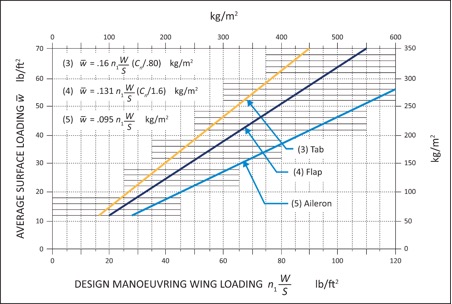
FIGURE A5
AVERAGE LIMIT CONTROL SURFACE LOADING.