Appendix C – Icing Certification
ED Decision 2003/16/RM
(a) The maximum continuous intensity of atmospheric icing conditions (continuous maximum icing) is defined by the variables of the cloud liquid water content, the mean effective diameter of the cloud droplets, the ambient air temperature, and the interrelationship of these three variables as shown in figure 1 of this appendix. The limiting icing envelope in terms of altitude and temperature is given in figure 2 of this appendix. The interrelationship of cloud liquid water content with drop diameter and altitude is determined from figures 1 and 2. The cloud liquid water content for continuous maximum icing conditions of a horizontal extent, other than 32.2 km (17.4 nautical miles), is determined by the value of liquid water content of figure 1, multiplied by the appropriate factor from figure 3 of this appendix.
(b) The intermittent maximum intensity of atmospheric icing conditions (intermittent maximum icing) is defined by the variables of the cloud liquid water content, the mean effective diameter of the cloud droplets, the ambient air temperature, and the interrelationship of these three variables as shown in figure 4 of this appendix. The limiting icing envelope in terms of altitude and temperature is given in figure 5 of this appendix. The interrelationship of cloud liquid water content with drop diameter and altitude is determined from figures 4 and 5. The cloud liquid water content for intermittent maximum icing conditions of a horizontal extent, other than 4.8 km (2.6 nautical miles), is determined by the value of cloud liquid water content of figure 4 multiplied by the appropriate factor in figure 6 of this appendix.
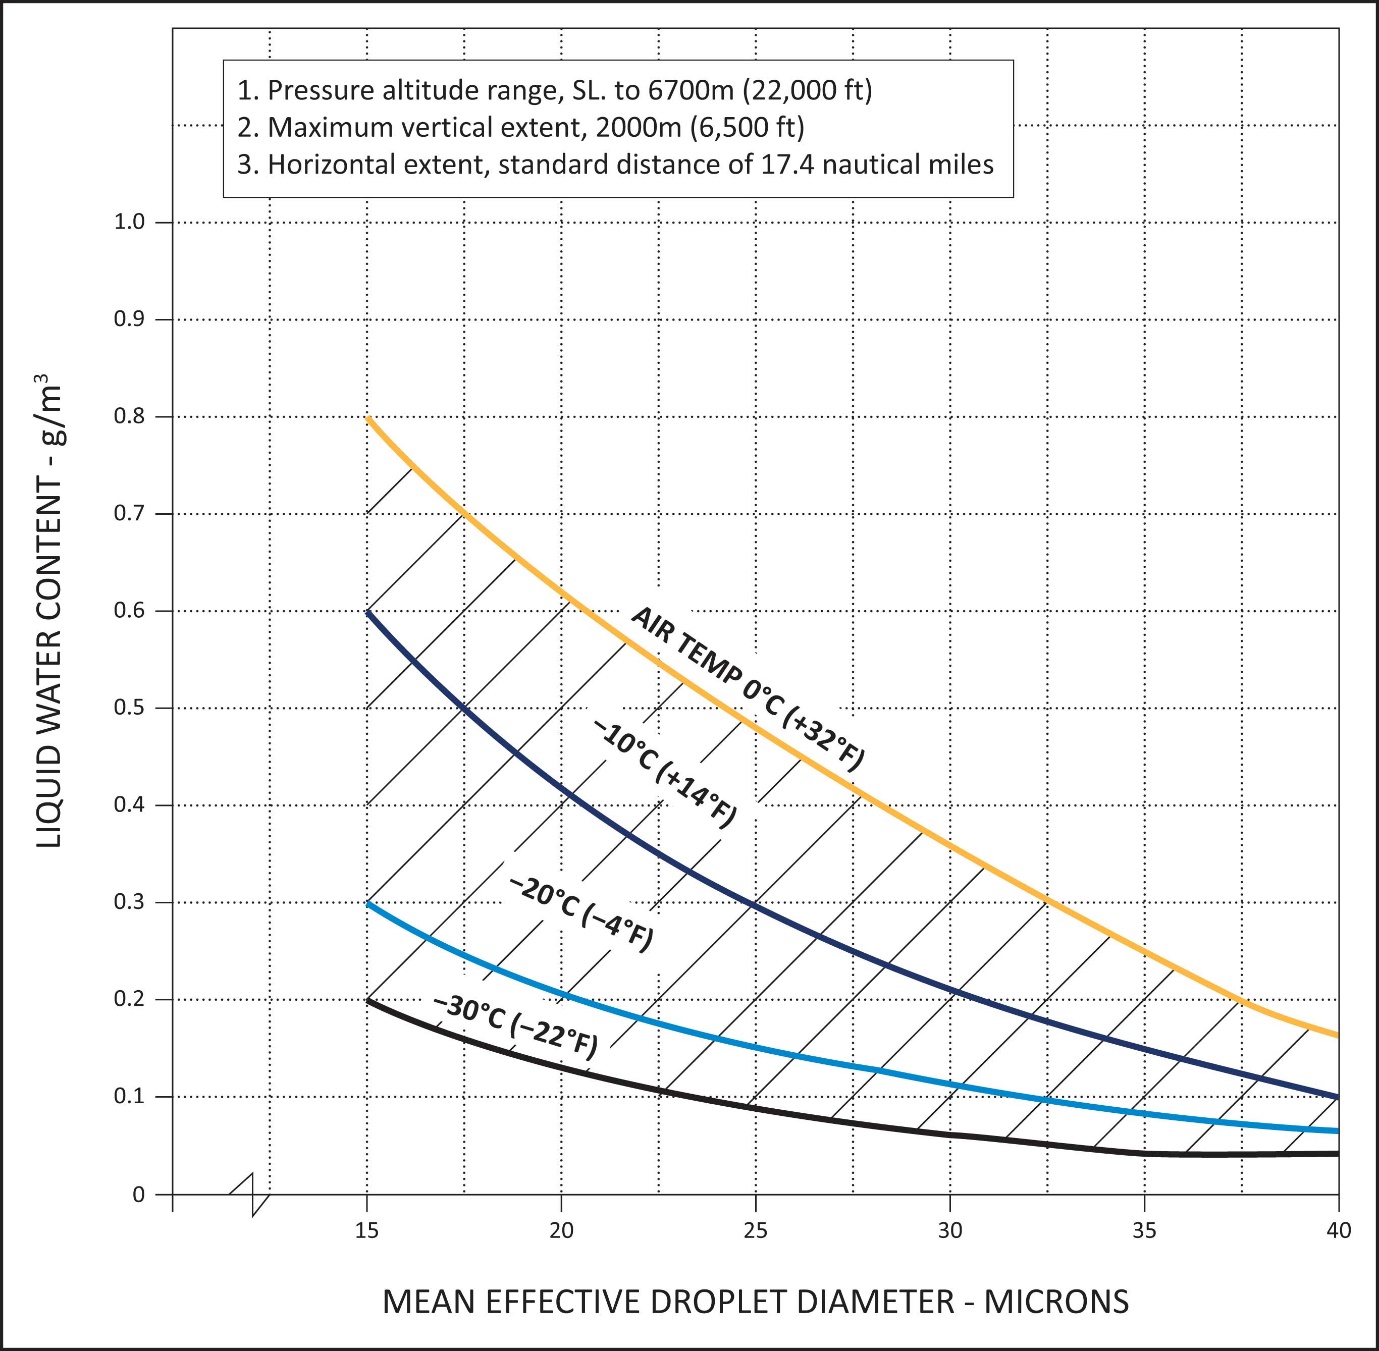
FIGURE 1
CONTINUOUS MAXIMUM (STRATIFORM CLOUDS) ATMOSPHERIC ICING CONDITIONS
LIQUID WATER CONTENT VS MEAN EFFECTIVE DROP DIAMETER
Source of data – NACA TN No. 1855, Class III - M, Continuous Maximum.
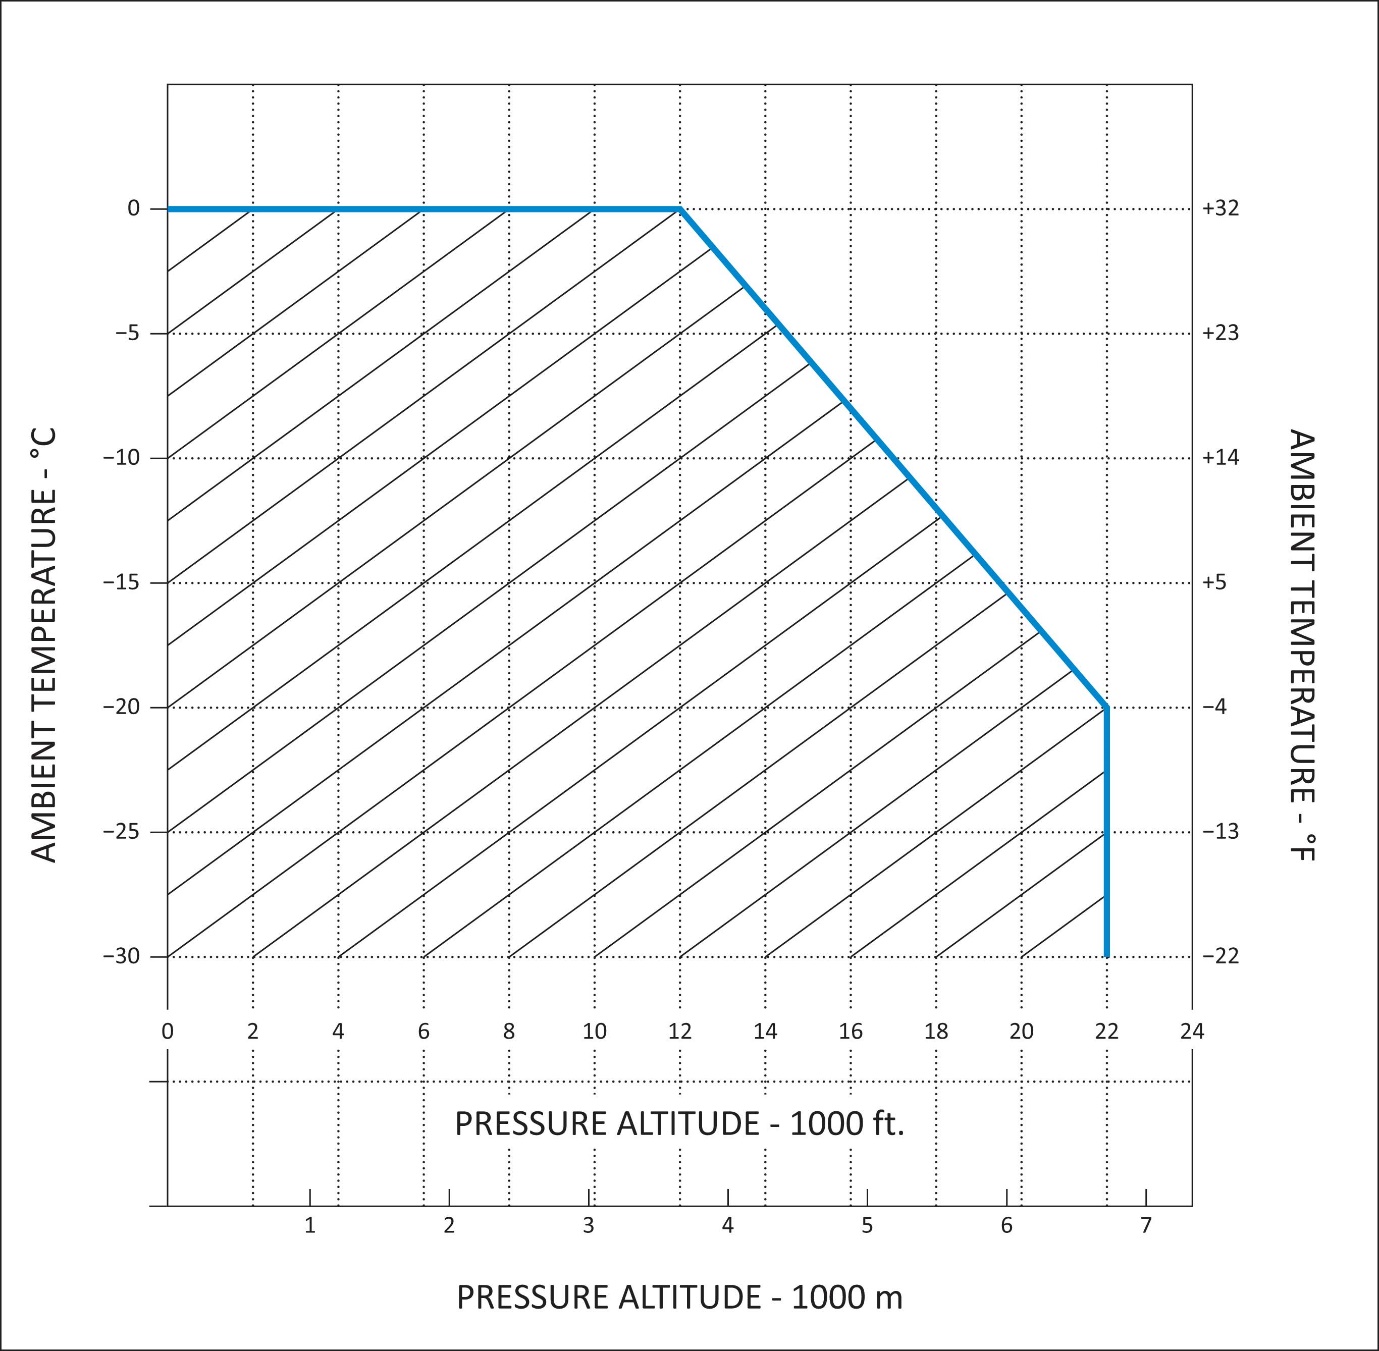
FIGURE 2
CONTINUOUS MAXIMUM (STRATIFORM CLOUDS) ATMOSPHERIC ICING CONDITIONS
AMBIENT TEMPERATURE VS PRESSURE ALTITUDE
Source of data – NACA TN No. 2569.
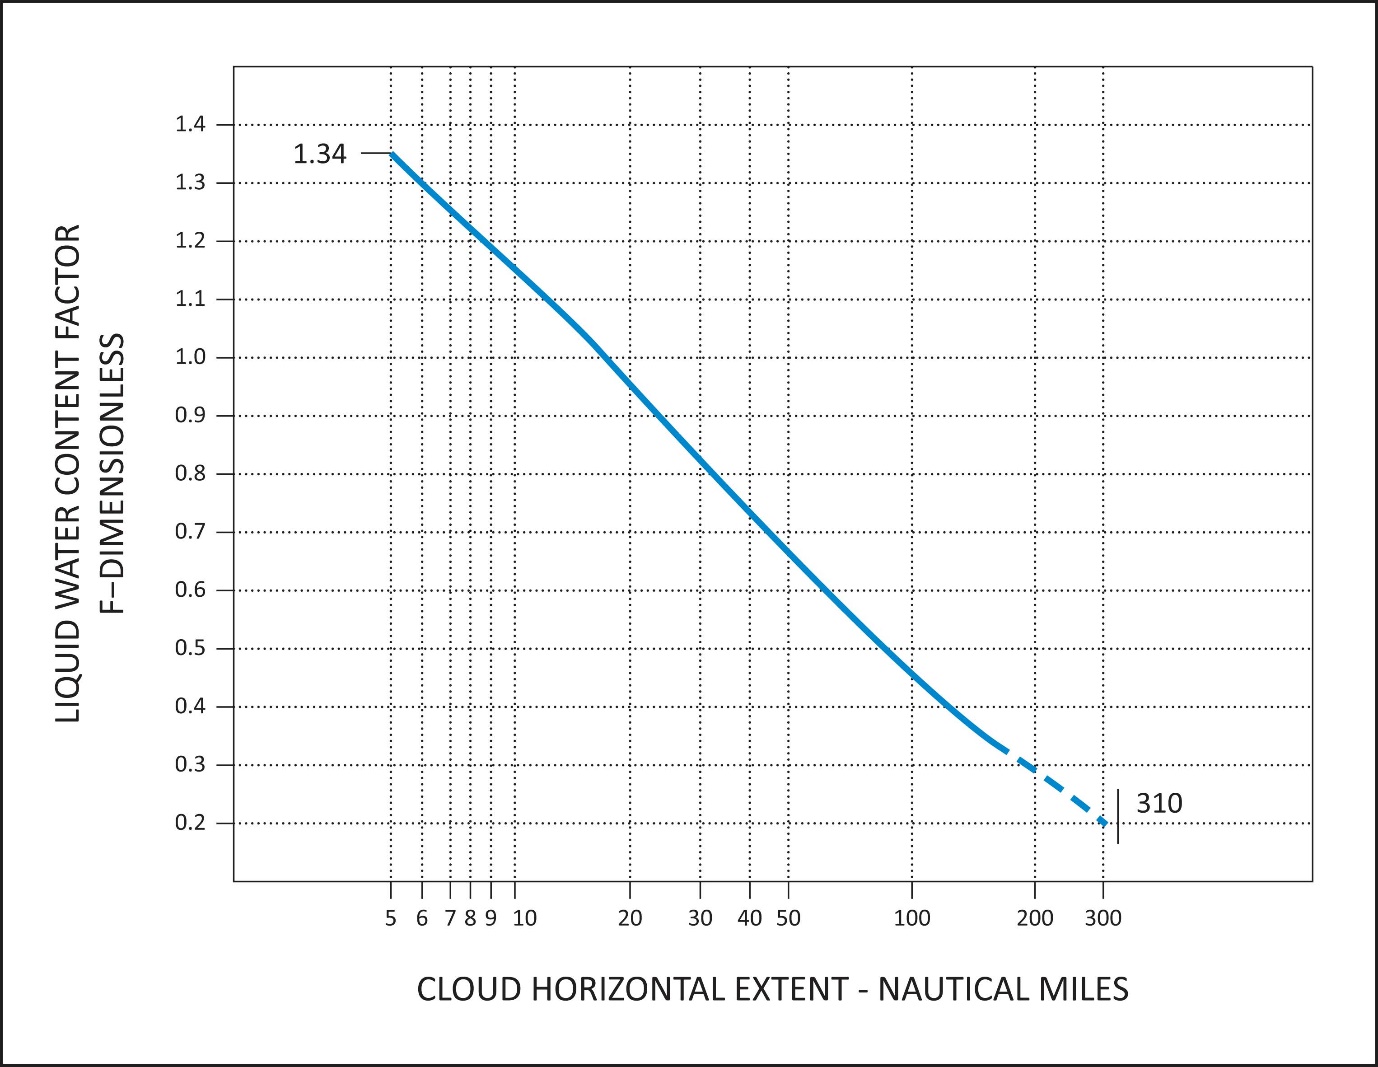
FIGURE 3
CONTINUOUS MAXIMUM (STRATIFORM CLOUDS) ATMOSPHERIC ICING CONDITIONS
LIQUID WATER CONTENT FACTOR VS CLOUD HORIZONTAL DISTANCE
Source of data – NACA TN No. 2738.
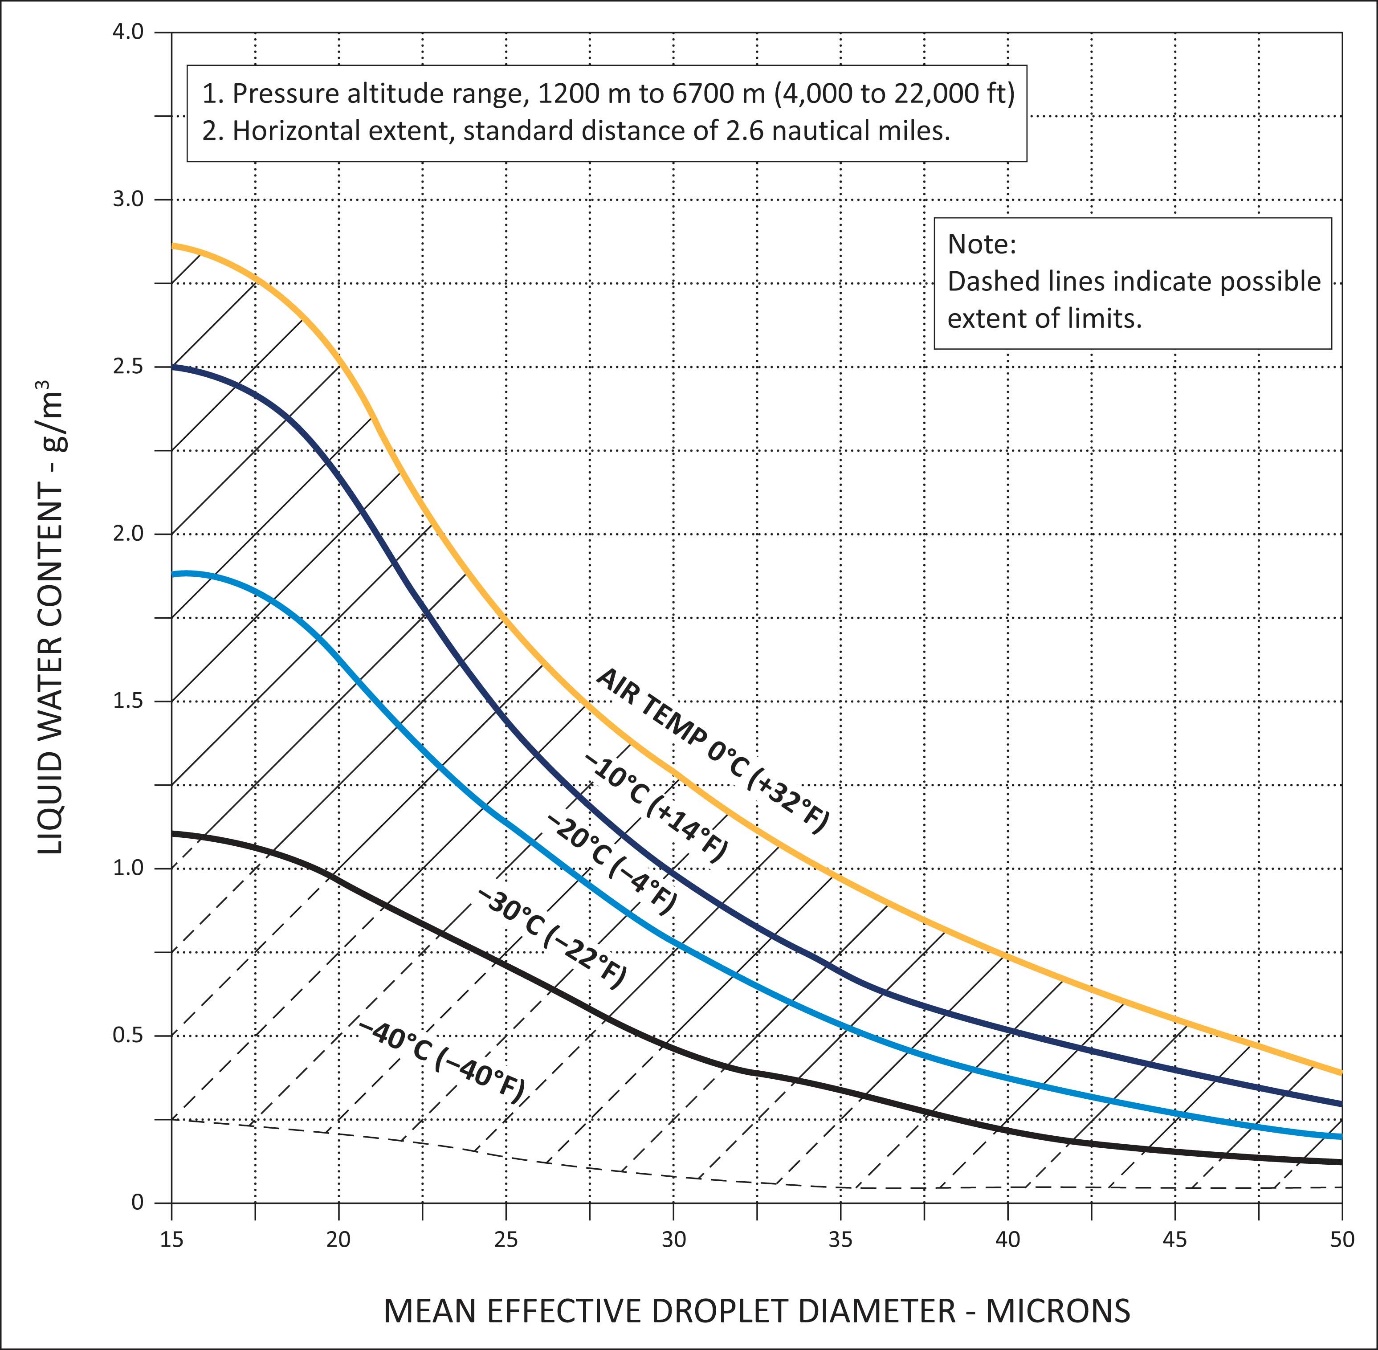
FIGURE 4
INTERMITTENT MAXIMUM (CUMULIFORM CLOUDS) ATMOSPHERIC ICING CONDITIONS
LIQUID WATER CONTENT VS MEAN EFFECTIVE DROP DIAMETER
Source of data – NACA TN No. 1855, Class II - M, Intermittent Maximum.
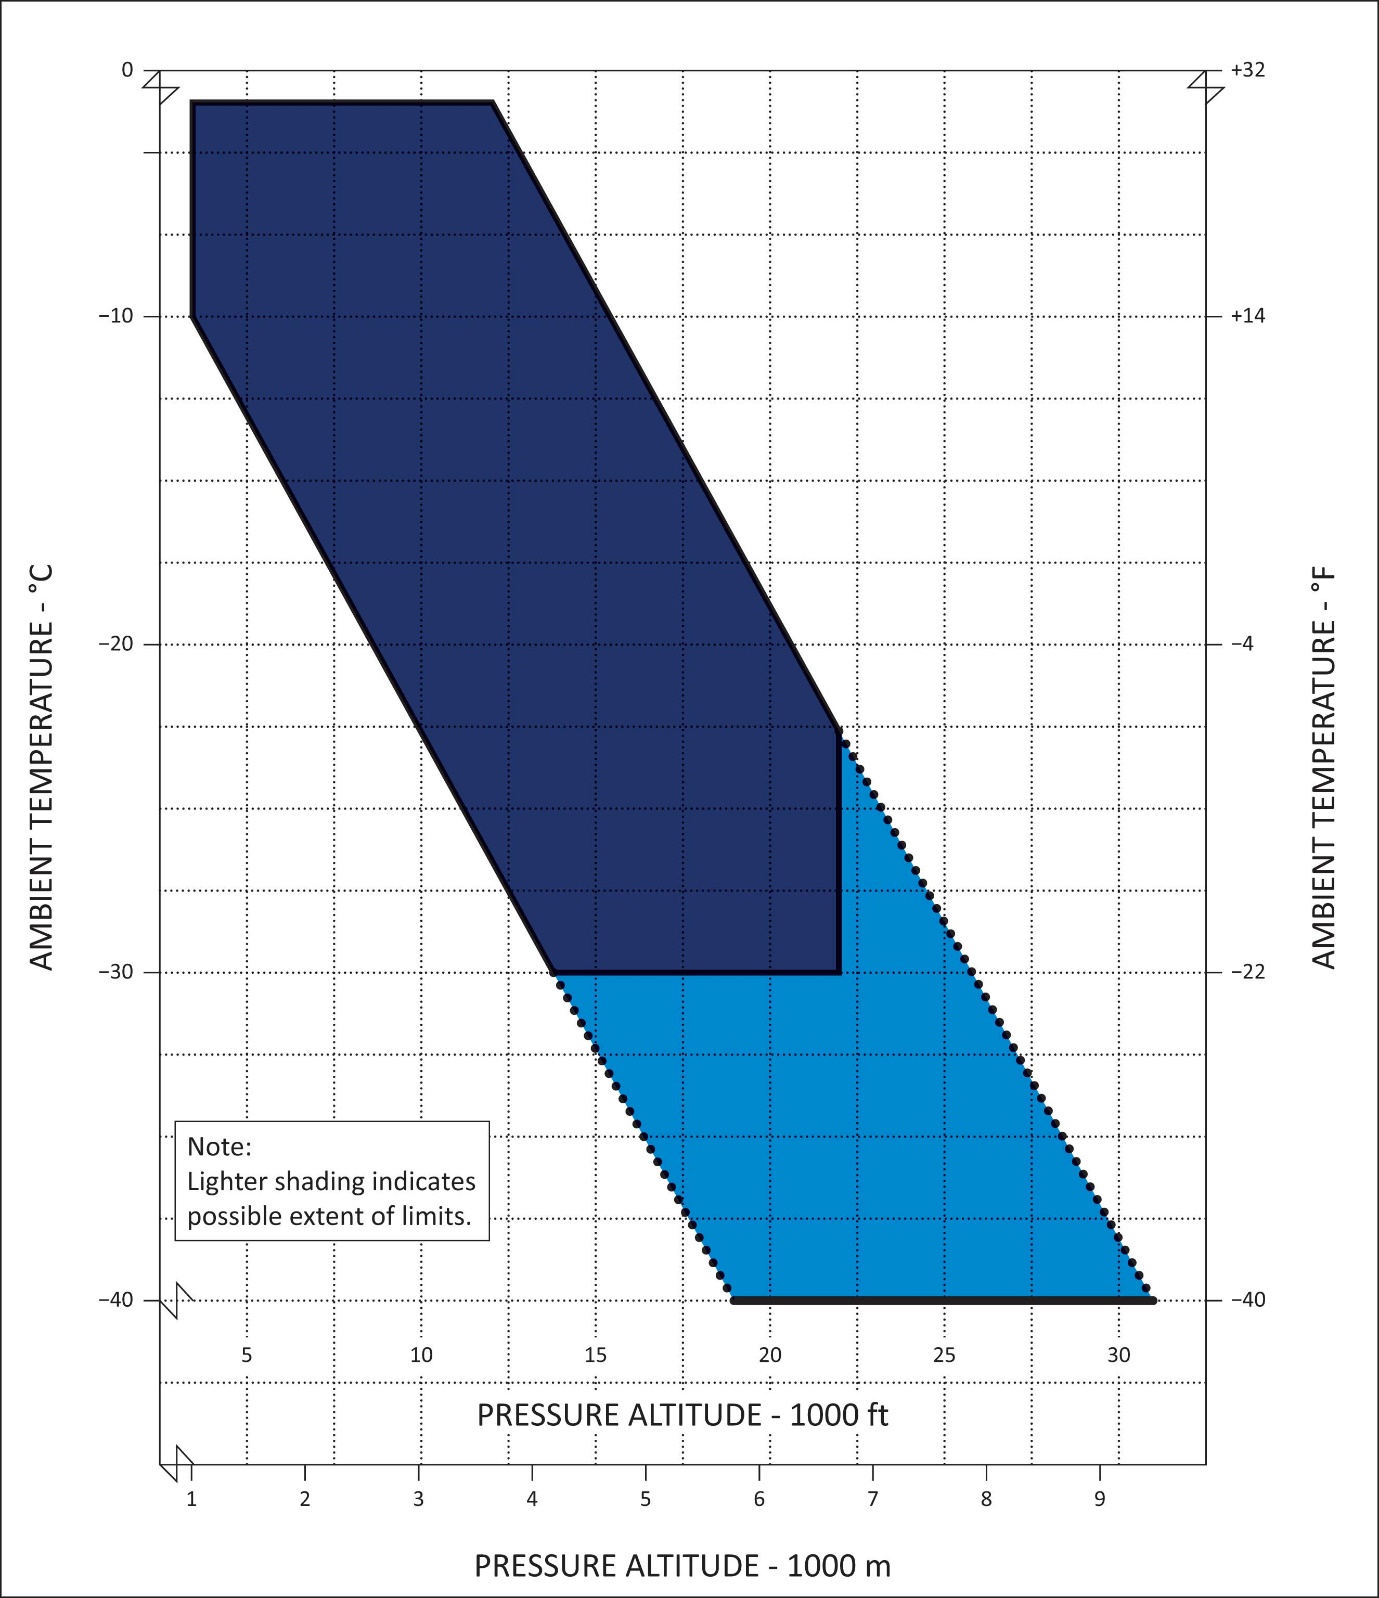
FIGURE 5
INTERMITTENT MAXIMUM (CUMULIFORM CLOUDS) ATMOSPHERIC ICING CONDITIONS
AMBIENT TEMPERATURE VS PRESSURE ALTITUDE
Source of data – NACA TN No. 2569.
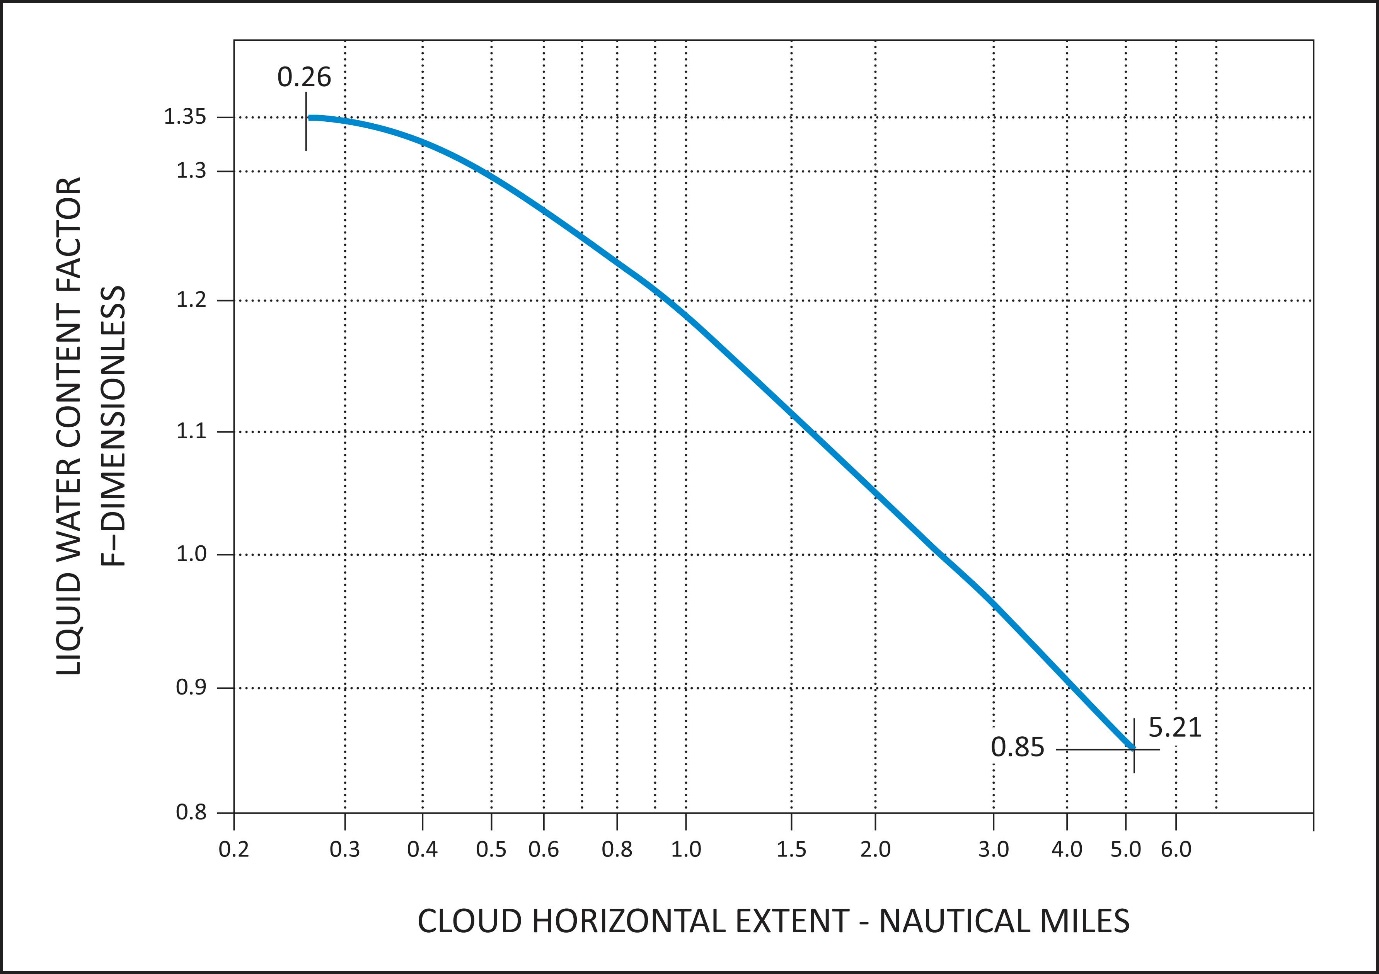
FIGURE 6
INTERMITTENT MAXIMUM (CUMULIFORM CLOUDS) ATMOSPHERIC ICING CONDITIONS
VARIATION OF LIQUID WATER CONTENT FACTOR WITH CLOUD HORIZONTAL EXTENT
Source of data – NACA TN No. 2738.