CS
ADR-DSN.U.940 Aeronautical ground light characteristics
ED Decision 2017/021/R
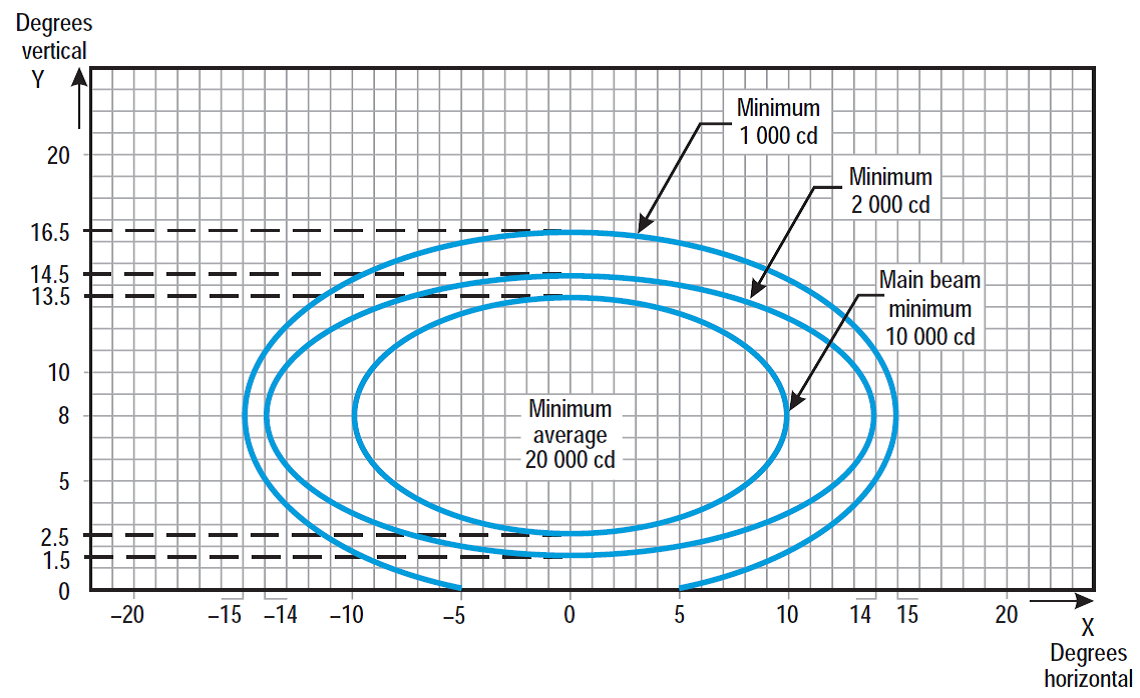
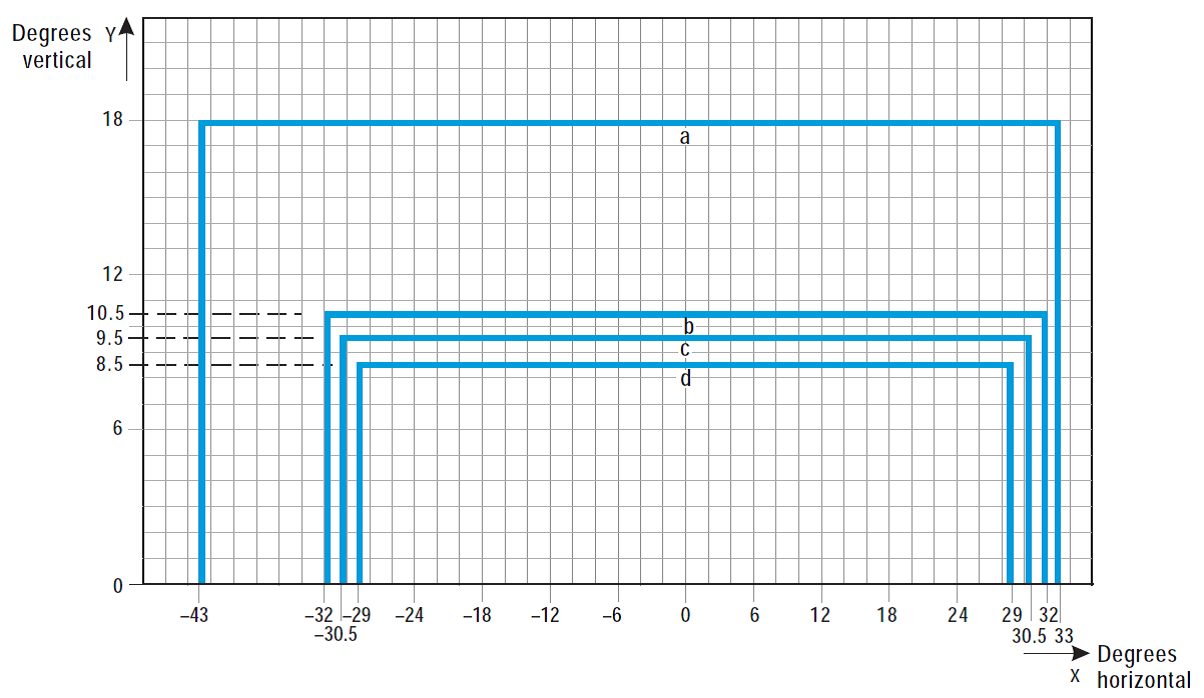
Figure U-5.
Isocandela diagram for approach centre line light and crossbars (white light)
Notes:
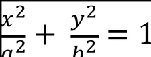
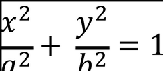
(a) Curves calculated on formula
|
a |
10 |
14 |
15 |
|
b |
5.5 |
6.5 |
8.5 |

(b) Vertical setting angles of the lights should be such that the following vertical coverage of the main beam should be met:
|
distance from
threshold |
vertical main
beam coverage |
|
threshold to 315 m |
0° - 11° |
|
316 m to 475 m |
0.5° - 11.5° |
|
476 m to 640 m |
1.5° - 12.5° |
|
641 m and beyond |
2.5° -13.5° (as illustrated above) |
(c) Lights in crossbars beyond 22.5 m from the centre line should be toed-in 2 degrees. All other lights should be aligned parallel to the centre line of the runway.
(d) See collective notes for Figures U-5 to U-15.
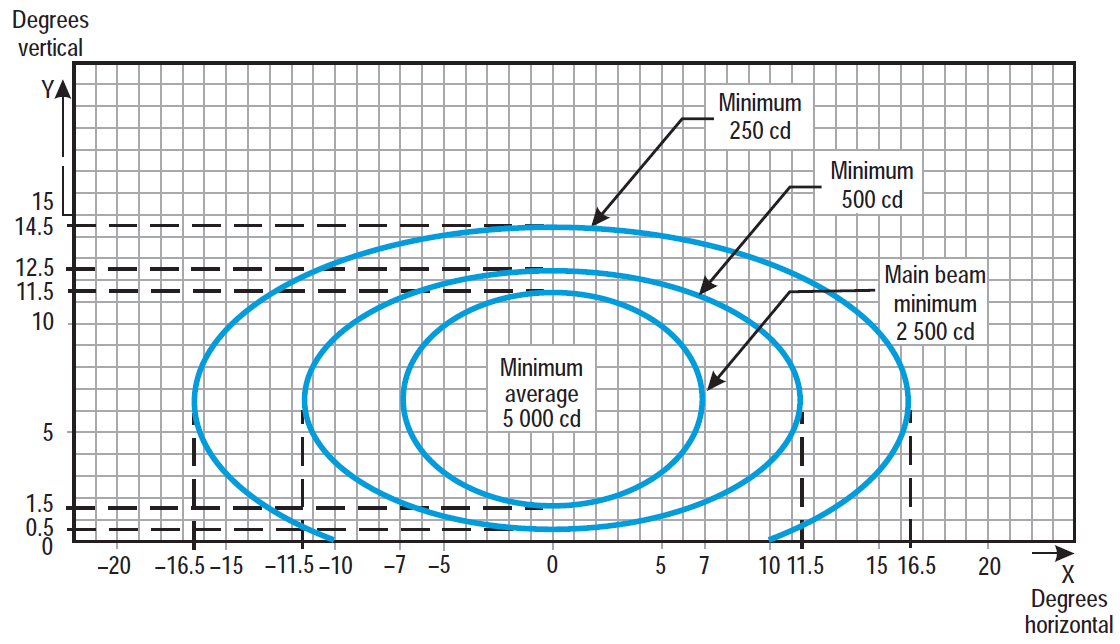
Figure U-6.
Isocandela diagram for approach side row light (red light)
Notes:
(a) Curves calculated on formula
|
a |
7.0 |
11.5 |
16.5 |
|
b |
5.0 |
6.0 |
8.0 |
(b) Toe-in 2 degrees
(c) Vertical setting angles of the lights should be such that the following vertical coverage of the main beam should be met:
|
distance from
threshold |
vertical main
beam coverage |
|
threshold to 115 m |
0.5° - 10.5° |
|
116 m to 215 m |
1° - 11° |
|
216 m and beyond |
1.5° - 11.5° (as illustrated above) |
(d) See collective notes for Figures U-5 to U-15.
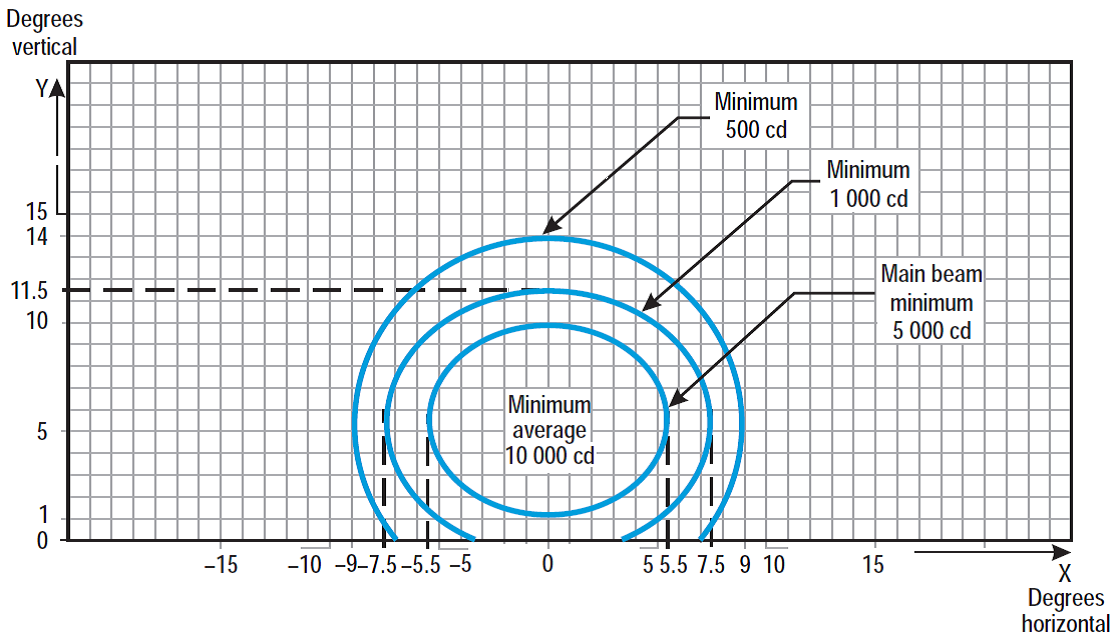
Figure U-7.
Isocandela diagram for threshold light (green light)
Notes:
(a) Curves calculated on formula
|
a |
5.5 |
7.5 |
9.0 |
|
b |
4.5 |
6.0 |
8.5 |
(b) Toe-in 3.5 degrees
(c) See collective notes for Figures U-5 to U-15.
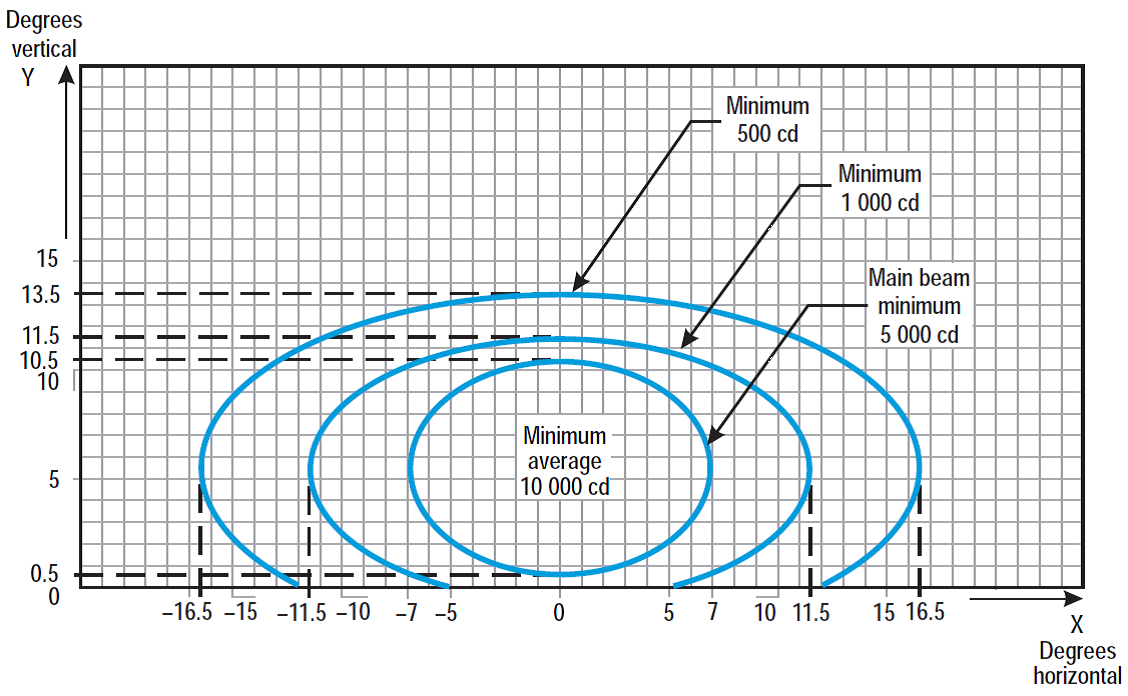
Figure U-8.
Isocandela diagram for threshold wing bar light (green light)
Notes:
(a) Curves calculated on formula
|
a |
7.0 |
11.5 |
16.5 |
|
b |
5.0 |
6.0 |
8.0 |

(b) Toe-in 2 degrees
(c) See collective notes for Figures U-5 to U-15.
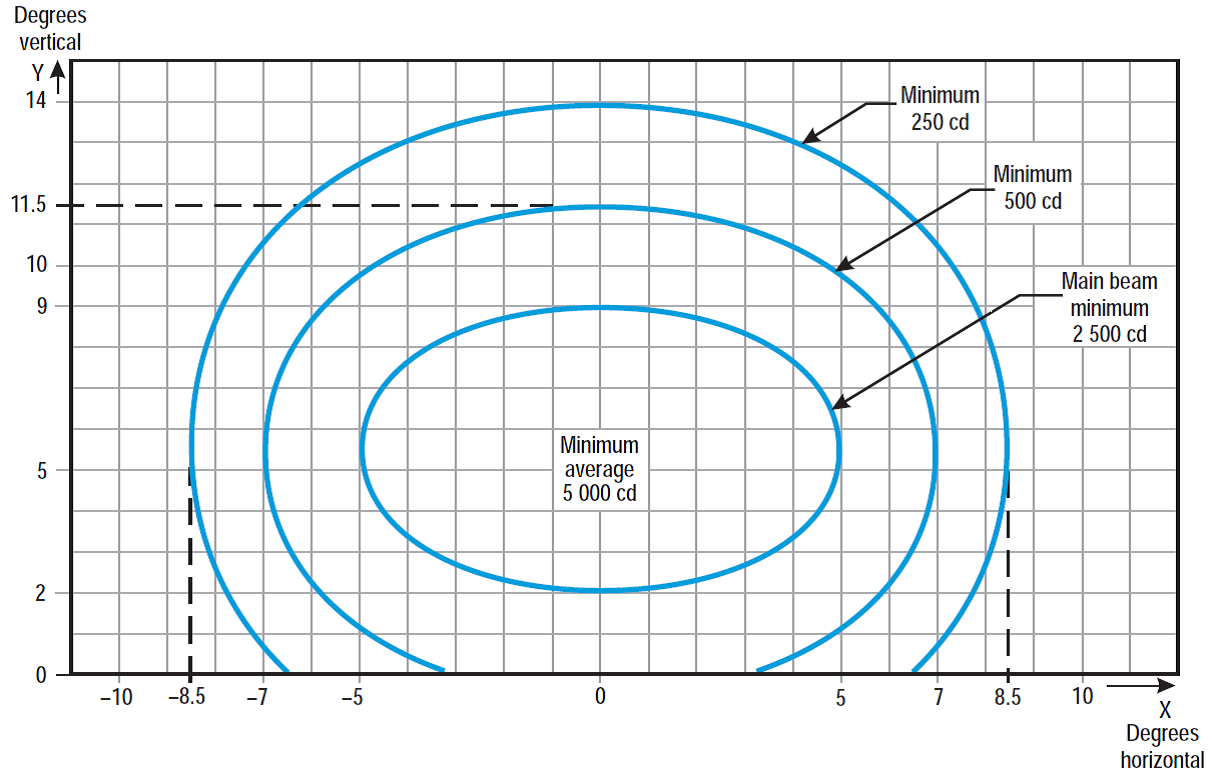
Figure U-9.
Isocandela diagram for touchdown zone light (white light)
Notes:
(a) Curves calculated on formula
|
a |
5.0 |
7.0 |
8.5 |
|
b |
3.5 |
6.0 |
8.5 |

(b) Toe-in 4 degrees
(c) See collective notes for Figures U-5 to U-15.
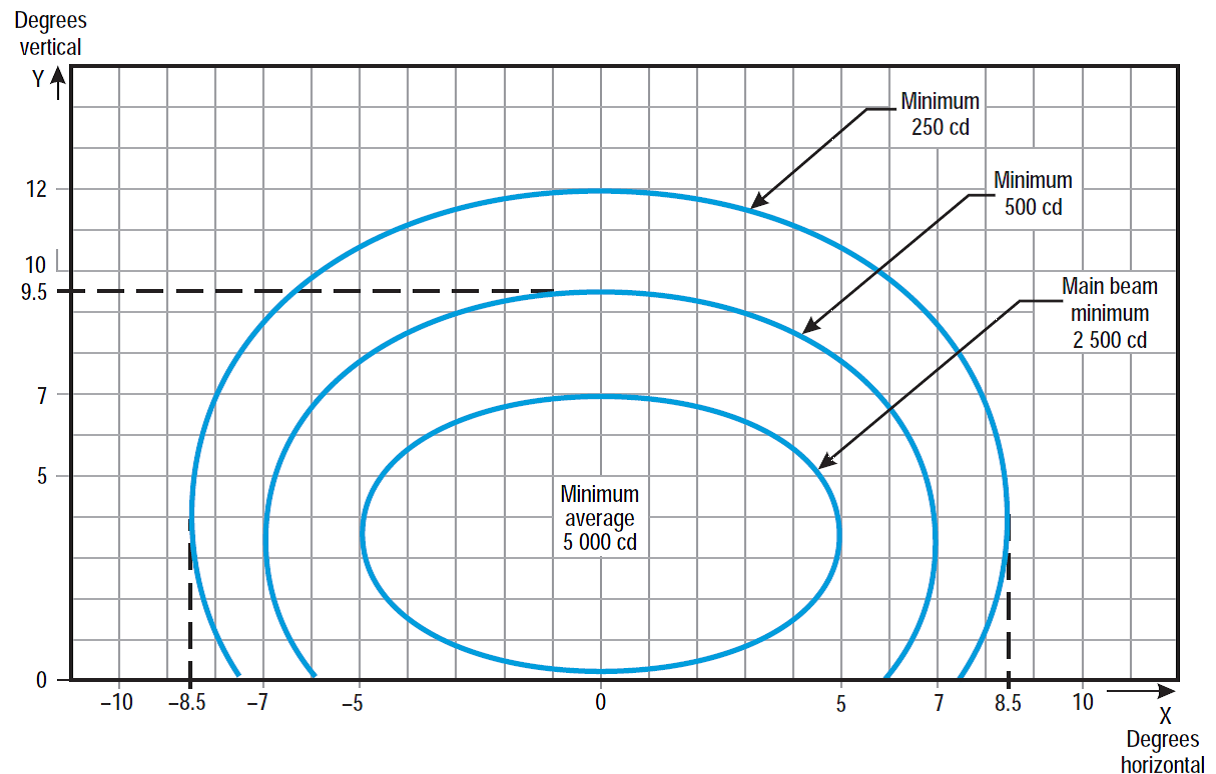
Figure U-10.
Isocandela diagram for runway centre line light with 30 m longitudinal
spacing (white light) and rapid exit taxiway indicator light (yellow light)
Notes:
(a) Curves calculated on formula
|
a |
5.0 |
7.0 |
8.5 |
|
b |
3.5 |
6.0 |
8.5 |

(b) For red light, multiply values by 0.15.
(c) For yellow light, multiply values by 0.40.
(d) See collective notes for Figures U-5 to U-15.
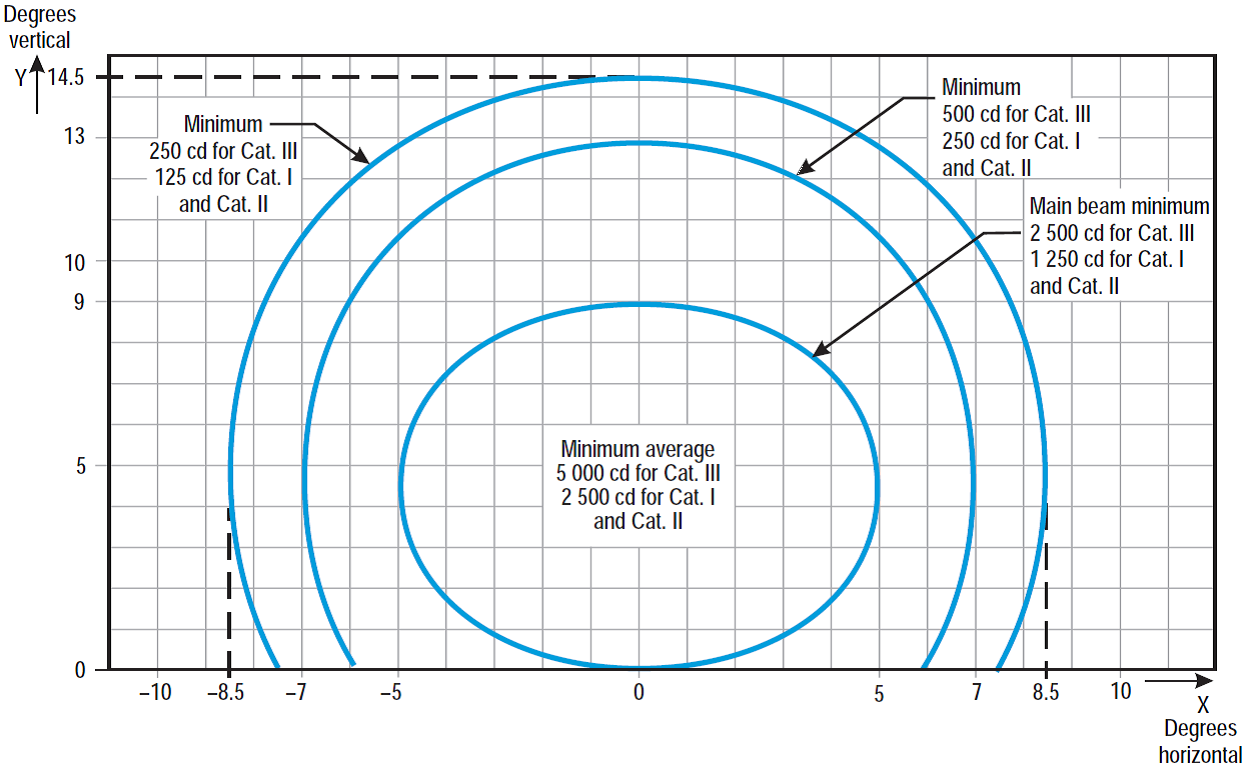
Figure U-11.
Isocandela diagram for runway centre line light with 15 m longitudinal
spacing (white light) and rapid exit taxiway indicator light (yellow light)
Notes:
(a) Curves calculated on formula
|
a |
5.0 |
7.0 |
8.5 |
|
b |
3.5 |
6.0 |
8.5 |

(b) For red light, multiply values by 0.15.
(c) For yellow light, multiply values by 0.40.
(d) See collective notes for Figures U-5 to U-15.
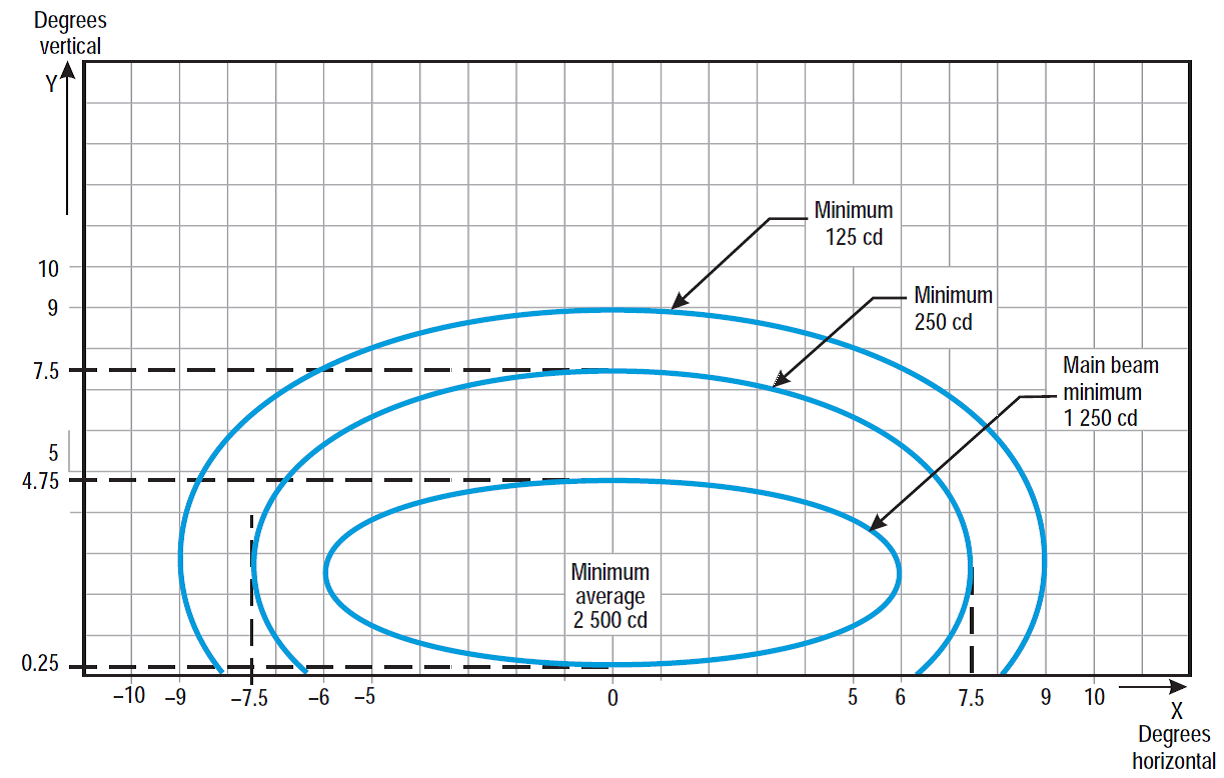
Figure U-12.
Isocandela diagram for runway end light (red light)
Notes:
(a) Curves calculated on formula
|
a |
6.0 |
7.5 |
9.0 |
|
b |
2.25 |
5.0 |
6.5 |

(b) See collective notes for Figures U-5 to U-15.
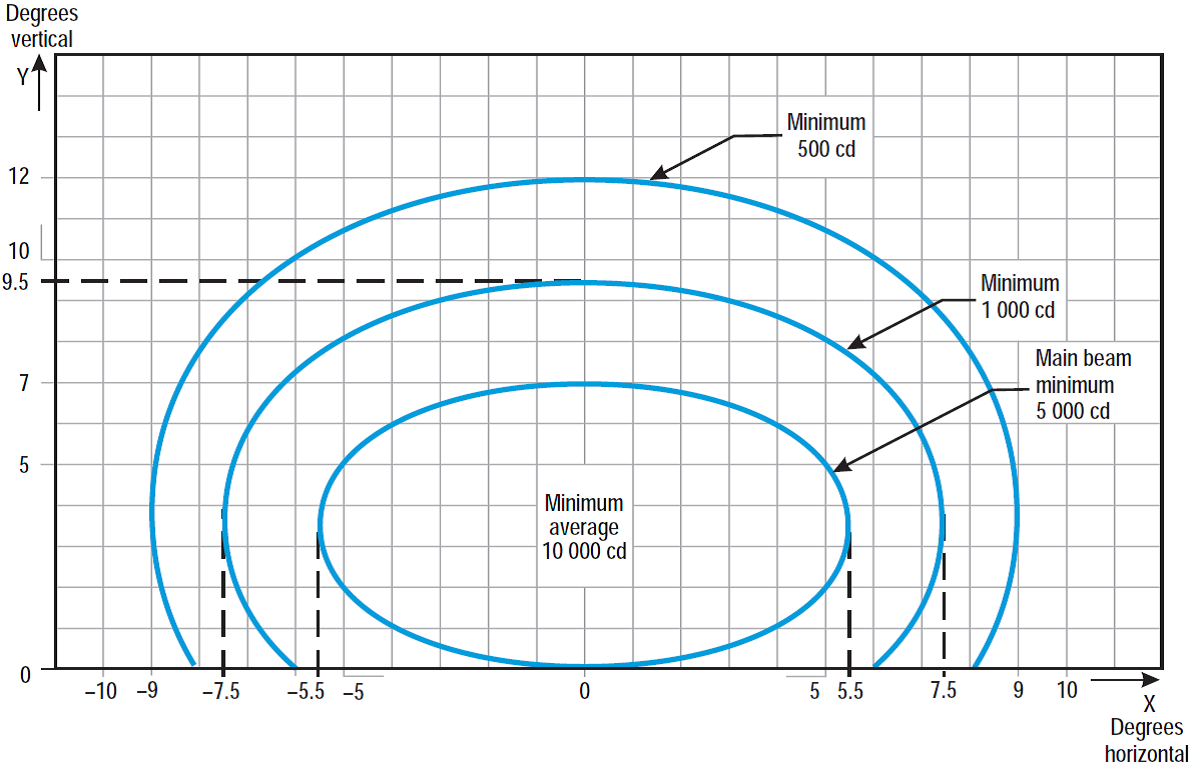
Figure U-13.
Isocandela diagram for runway edge light where width of runway is 45 m
(white light)
Notes:
(a) Curves calculated on formula
|
a |
5.5 |
7.5 |
9.0 |
|
b |
3.5 |
6.0 |
8.5 |

(b) Toe-in 3.5 degrees
(c) For red light, multiply values by 0.15.
(d) For yellow light, multiply values by 0.40.
(e) See collective notes for Figures U-5 to U-15.
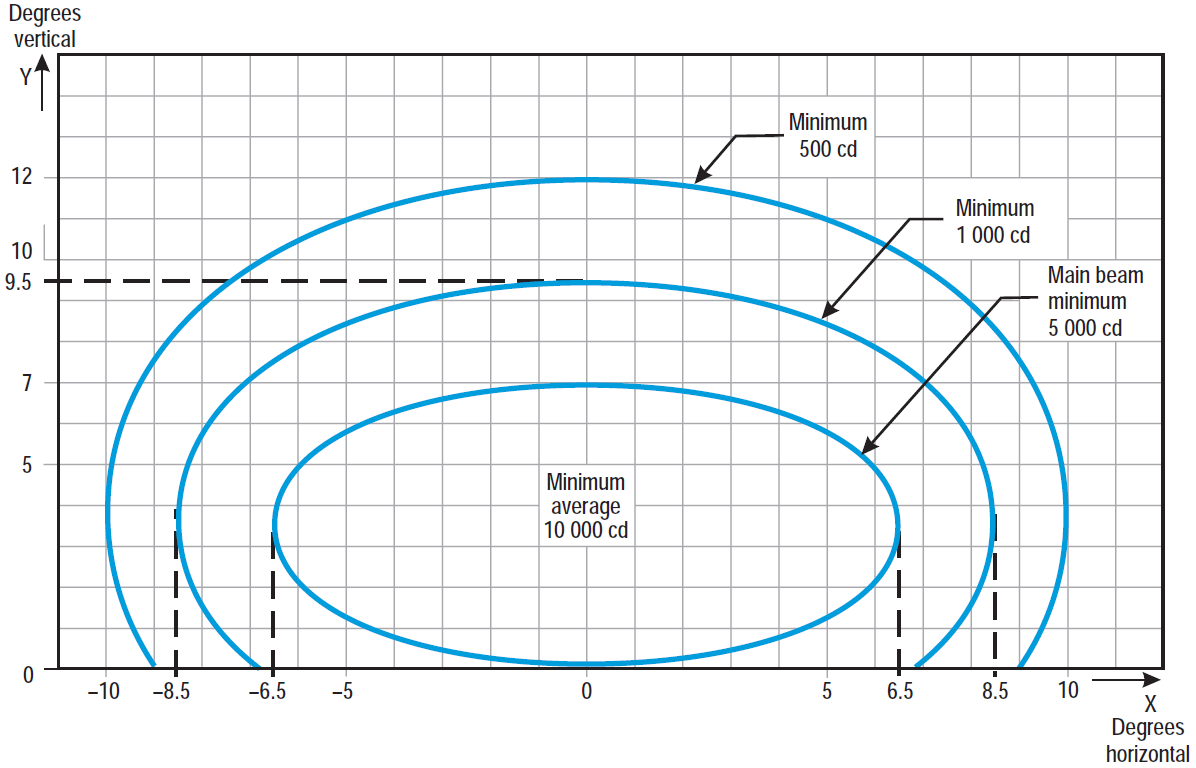
Figure U-14.
Isocandela diagram for runway edge light where width of runway is 60 m
(white light)
Notes:
(a) Curves calculated on formula
|
a |
6.5 |
8.5 |
10.0 |
|
b |
3.5 |
6.0 |
8.5 |

(b) Toe-in 4.5 degrees
(c) For red light, multiply values by 0.15.
(d) For yellow light, multiply values by 0.40.
(e) See collective notes for Figures U-5 to U-15.
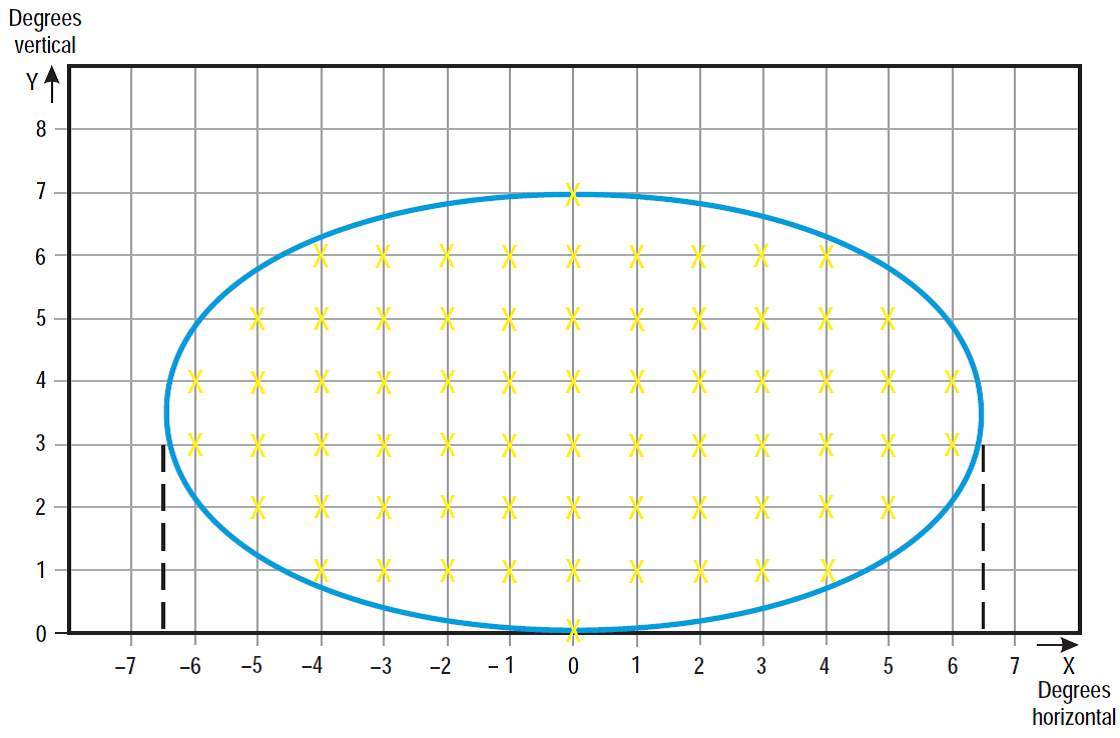
Figure U-15.
Grid points to be used for the calculation of average intensity of approach
and runway lights
Collective notes to Figures U-5 to U-15
(a) The ellipses in each Figure are symmetrical about the common vertical and horizontal axes.
(b) Figures U-5 to U-14 show the minimum allowable light intensities. The average intensity of the main beam is calculated by establishing grid points as shown in Figure U-15 and using the intensity value measures at all grid points located within and on the perimeter of the ellipse representing the main beam. The average value is the arithmetic average of light intensities measured at all considered grid points.
(c) No deviations are acceptable in the main beam pattern when the lighting fixture is properly aimed.
(d) Average intensity ratio. The ratio between the average intensity within the ellipse defining the main beam of a typical new light and the average light intensity of the main beam of a new runway edge light should be as follows:
|
Figure U-5 |
Approach centre line and crossbars |
1.5 to 2.0 |
(white light) |
|
Figure U-6 |
Approach side row |
0.5 to 1.0 |
(red light) |
|
Figure U-7 |
Threshold |
1.0 to 1.5 |
(green light) |
|
Figure U-8 |
Threshold wing bar |
1.0 to 1.5 |
(green light) |
|
Figure U-9 |
Touchdown zone |
0.5 to 1.0 |
(white light) |
|
Figure U-10 |
Runway centre line (longitudinal spacing 30 m) |
0.5 to 1.0 |
(white light) |
|
Figure U-11 |
Runway centre line (longitudinal spacing 15 m) |
0.5 to 1.0 for CAT III |
(white light) |
|
0.25 to 0.5 for CAT I, II |
(white light) |
||
|
Figure U-12 |
Runway end |
0.25 to 0.5 |
(red light) |
|
Figure U-13 |
Runway edge (45 m runway width) |
1.0 |
(white light) |
|
Figure U-14 |
Runway edge (60 m runway width) |
1.0 |
(white light) |
(e) The beam coverages in the Figures provide the necessary guidance for approaches down to an RVR of the order of 150 m and take-offs down to an RVR of the order of 100 m.
(f) Horizontal angles are measured with respect to the vertical plane through the runway centre line. For lights other than centre line lights, the direction towards the runway centre line is considered positive. Vertical angles are measured with respect to the horizontal plane.
(g) Where, for approach centre line lights and crossbars and for approach side row lights, inset lights are used in lieu of elevated lights, e.g. on a runway with a displaced threshold, the intensity requirements can be met by installing two or three fittings (lower intensity) at each position.
(h) The importance of adequate maintenance cannot be overemphasised. The average intensity should never fall to a value less than 50 % of the value shown in the Figures, and it should be the aim of aerodrome operator to maintain a level of light output close to the specified minimum average intensity.
(i) The light unit should be installed so that the main beam is aligned within one-half degree of the specified.
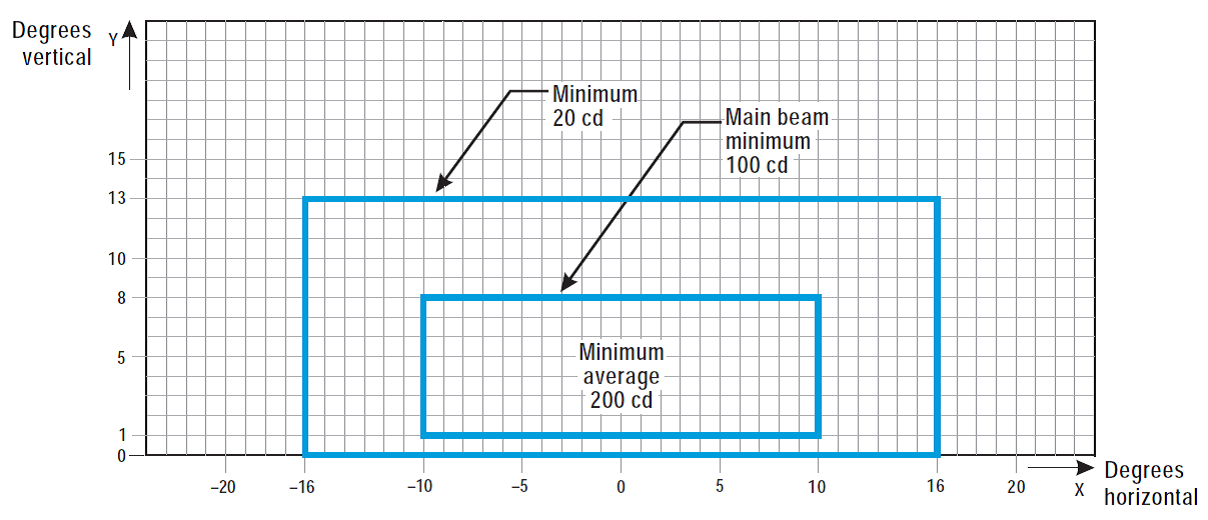
Figure U-16.
Isocandela diagram for taxiway centre line (15 m spacing), RELs, no-entry
bar, and stop bar lights in straight sections intended for use in runway
visual range conditions of less than a value of 350 m where large offsets
can occur and for low-intensity runway guard lights, Configuration B
Notes:
(a) These beam coverages allow for displacement of the cockpit from the centre line up to distances of the order of 12 m and are intended for use before and after curves.
(b) See collective notes for Figures U-16 to U-25.
(c) Increased intensities for enhanced rapid exit taxiway centre line lights are four times the respective intensities in the figure (i.e. 800 cd for minimum average main beam).
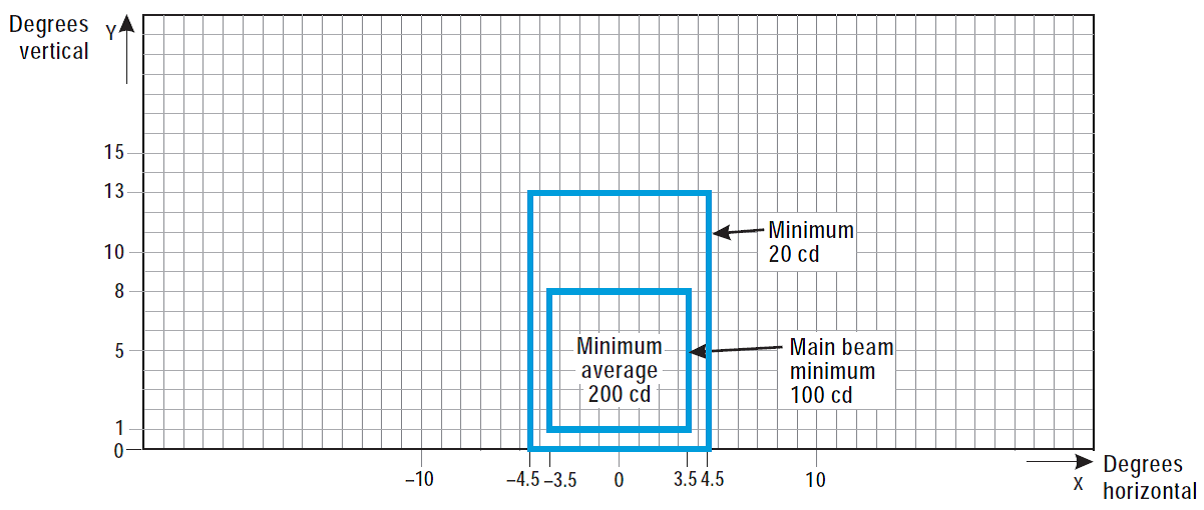
Figure U-17.
Isocandela diagram for taxiway centre line (15 m spacing), no-entry bar,
and stop bar lights in straight sections intended for use in runway visual
range conditions of less than a value of 350 m
Notes:
(a) These beam coverages are generally satisfactory and cater for a normal displacement of the cockpit from the centre line of approximately 3 m.
(b) See collective notes for Figures U-16 to U-25.
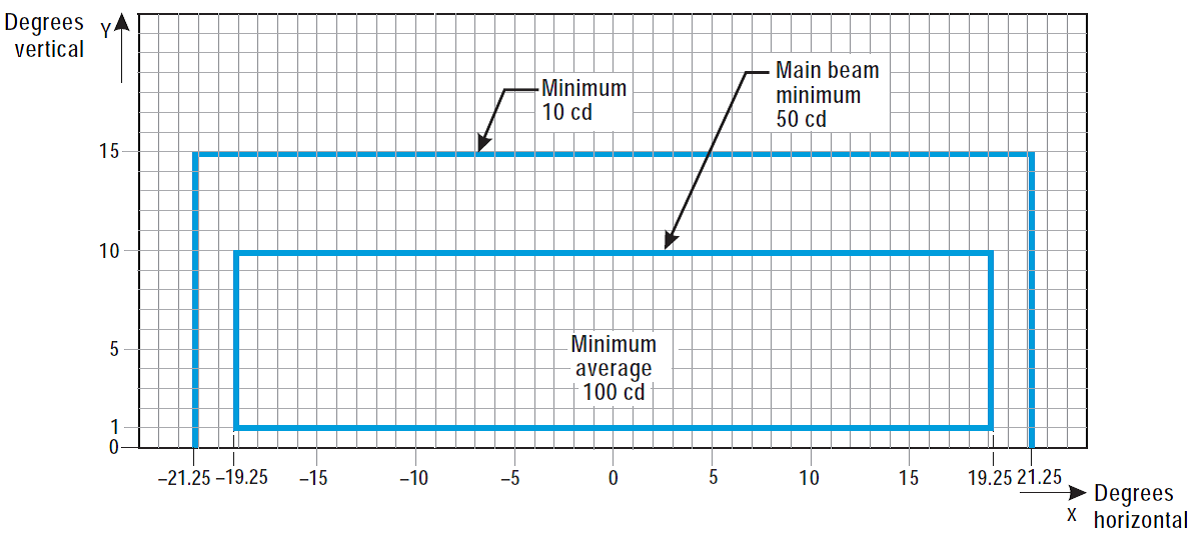
Figure U-18.
Isocandela diagram for taxiway centre line (7.5 m spacing), RELs, no-entry
bar, and stop bar lights in curved sections intended for use in runway visual
range conditions of less than a value of 350 m
Notes:
(a) Lights on curves to be toed-in 15.75 degrees with respect to the tangent of the curve. This does not apply to RELs.
(b) Where provided, increased intensities for RELs should be twice the specified intensities, i.e. minimum 20 cd, main beam minimum 100 cd, and minimum average 200 cd.
(c) See collective notes for Figures U-16 to U-25.
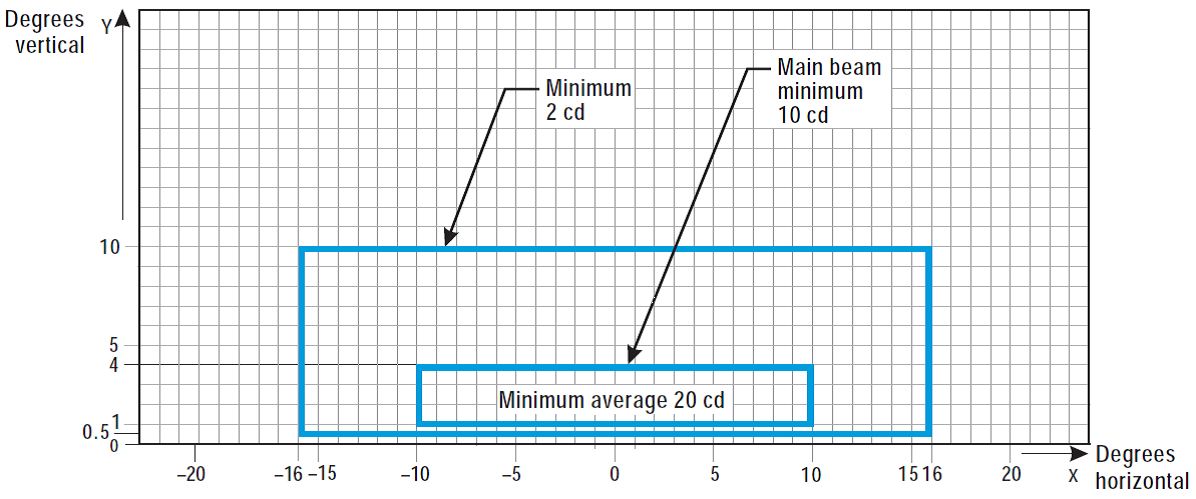
Figure U-19.
Isocandela diagram for taxiway centre line (30 m, 60 m spacing),
no-entry bar, and stop bar lights in straight sections intended for use in
runway visual range conditions of 350 m or greater
Notes:
(a) At locations where high background luminance is usual, and where deterioration of light output resulting from dust, snow, and local contamination is a significant factor, the cd-values should be multiplied by 2.5.
(b) Where omnidirectional lights are used they should comply with the vertical beam requirements in this Figure.
(c) See collective notes for Figures U-16 to U-25.
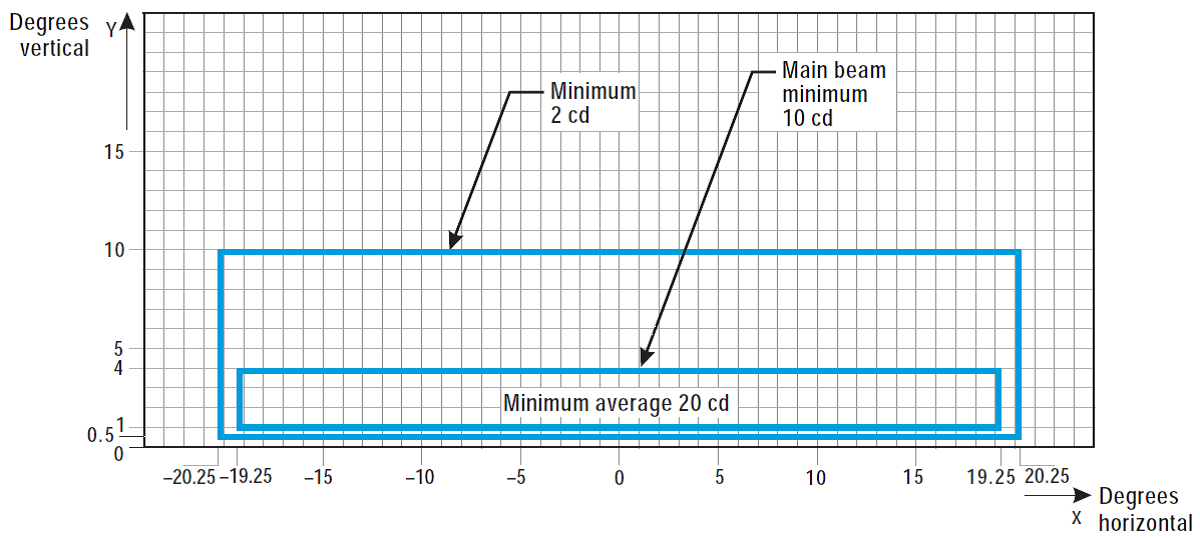
Figure U-20.
Isocandela diagram for taxiway centre line (7.5 m, 15 m, 30 m
spacing), no-entry bar, and stop bar lights in curved sections intended for
use in runway visual range conditions of 350 m or greater
Notes:
(a) Lights on curves to be toed-in 15.75 degrees with respect to the tangent of the curve.
(b) At locations where high background luminance is usual and where deterioration of light output resulting from dust, snow and, local contamination is a significant factor, the cd-values should be multiplied by 2.5.
(c) These beam coverages allow for displacement of the cockpit from the centre line up to distances of the order of 12 m as could occur at the end of curves.
(d) See collective notes for Figures U-16 to U-25.
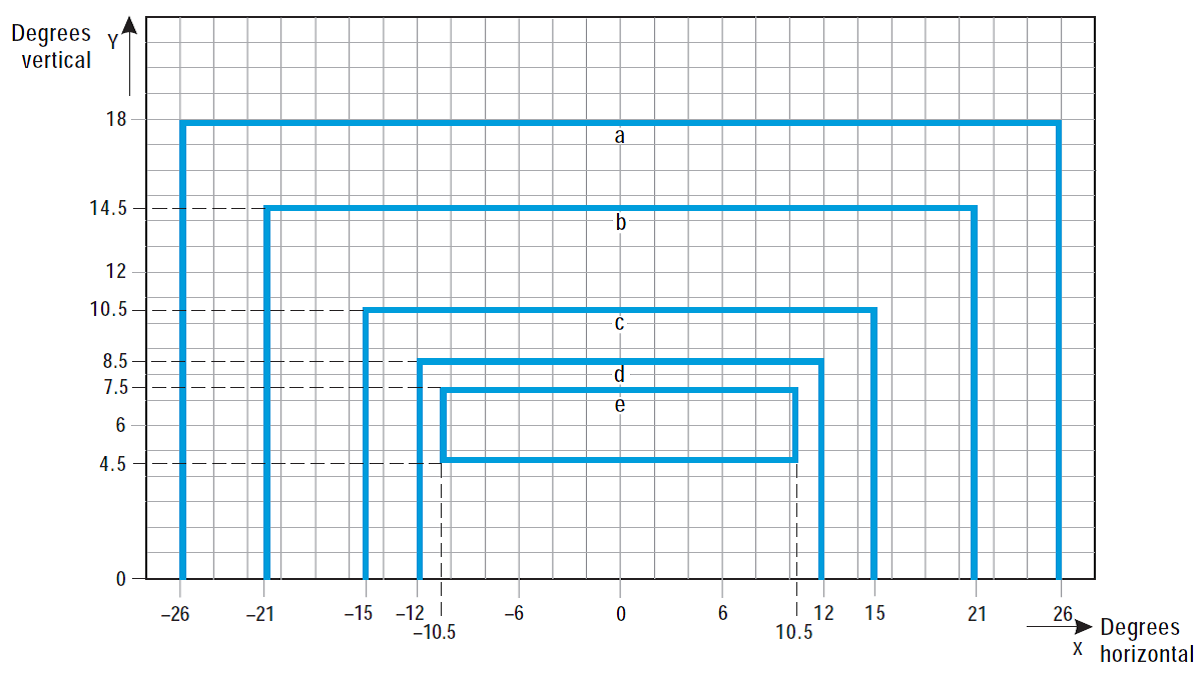
|
Curve |
a |
b |
c |
d |
e |
|
Intensity (cd) |
8 |
20 |
100 |
450 |
1800 |
Figure U-21.
Isocandela diagram for high-intensity taxiway centre line (15 m spacing),
no-entry bar, and stop bar lights in straight sections intended for use in an
advanced surface movement guidance and control system where higher light
intensities are required and where large offsets can occur.
Notes:
(a) These beam coverages are generally satisfactory and cater for a normal displacement of the cockpit corresponding to the outer main gear wheel on the taxiway edge.
(b) See collective notes for Figures U-16 to U-25.
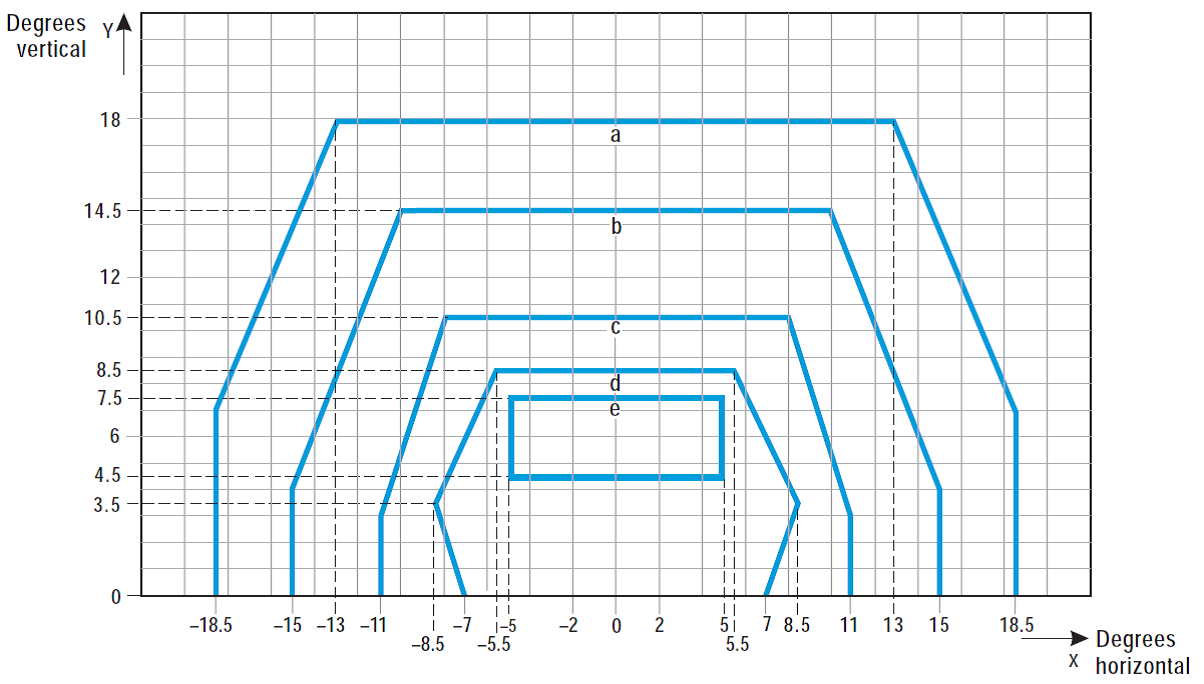
|
Curve |
a |
b |
c |
d |
e |
|
Intensity (cd) |
8 |
20 |
100 |
450 |
1800 |
Figure U-22.
Isocandela diagram for high-intensity taxiway centre line (15 m spacing),
no-entry bar, and stop bar lights in straight sections intended for use in an
advanced surface movement guidance and control system where higher light
intensities are required
Notes:
(a) These beam coverages are generally satisfactory and cater for a normal displacement of the cockpit corresponding to the outer main gear wheel on the taxiway edge.
(b) See collective notes for Figures U-16 to U-25.
|
Curve |
a |
b |
c |
d |
|
Intensity (cd) |
8 |
100 |
200 |
400 |
Figure U-23.
Isocandela diagram for high-intensity taxiway centre line (7.5 m
spacing), no-entry bar, and stop bar lights in curved sections intended for
use in an advanced surface movement guidance and control system where higher
light intensities are required
Notes:
(a) Lights on curves to be toed-in 17 degrees with respect to the tangent of the curve.
(b) See collective notes for Figures U-16 to U-25.
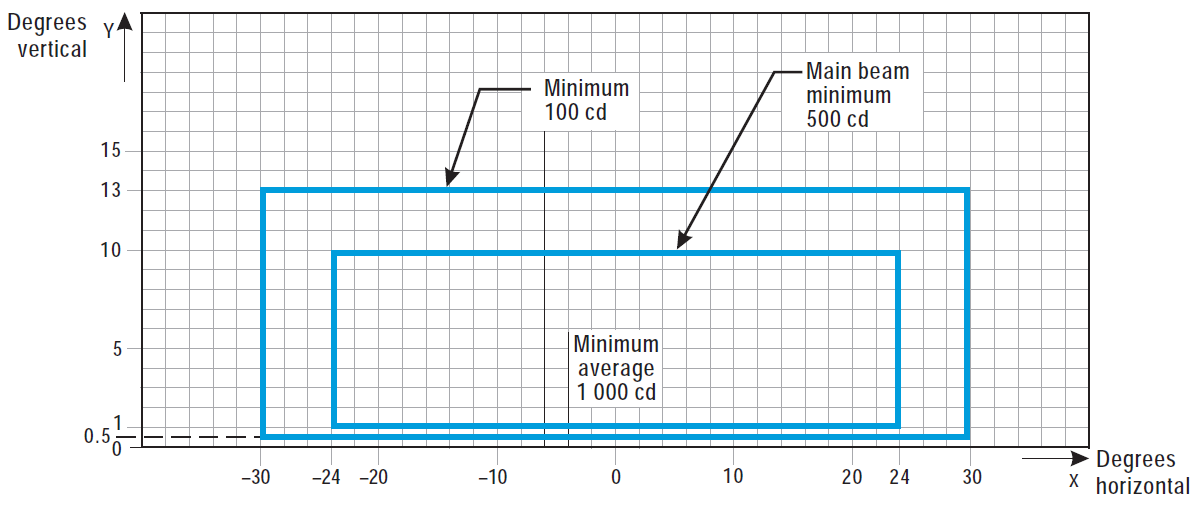
Figure U-24.
Isocandela diagram for high-intensity runway guard lights, Configuration B
Notes:
(a) Although the lights flash in normal operation, the light intensity is specified as if the lights were fixed for incandescent lamps.
(b) See collective notes for Figures U-16 to U-25.
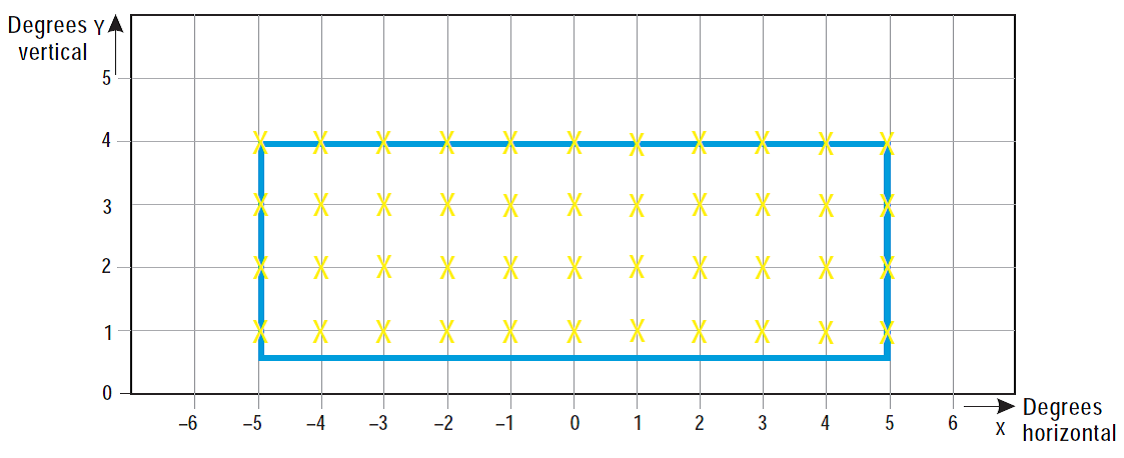
Figure U-25.
Grid points to be used for calculation of average intensity of taxiway centre
line and stop bar lights
Collective notes to Figures U-16 to U-25:
(a) The intensities specified in Figures U-16 to U-24 are in green and yellow light for taxiway centre line lights, yellow light for runway guard lights, and red light for stop bar lights.
(b) Figures U-16 to U-24 show the minimum allowable light intensities. The average intensity of the main beam is calculated by establishing grid points as shown in Figure U-25, and using the intensity values measured at all grid points located within and on the perimeter of the rectangle representing the main beam. The average value is the arithmetic average of the light intensities measured at all considered grid points.
(c) No deviations are acceptable in the main beam or in the innermost beam as applicable, when the lighting fixture is properly aimed.
(d) Horizontal angles are measured with respect to the vertical plane through the taxiway centre line, except on curves where they are measured with respect to the tangent to the curve.
(e) Vertical angles are measured from the longitudinal slope of the taxiway surface.
(f) The importance of adequate maintenance cannot be overemphasised. The intensity, either average where applicable or as specified on the corresponding isocandela curves, should never fall to a value less than 50 % of the value shown in the figures, and it should be the aim of aerodrome operator to maintain a level of light output close to the specified minimum average intensity.
(g) The light unit should be installed so that the main beam or the innermost beam as applicable, is aligned within one-half degree of the specified requirement.
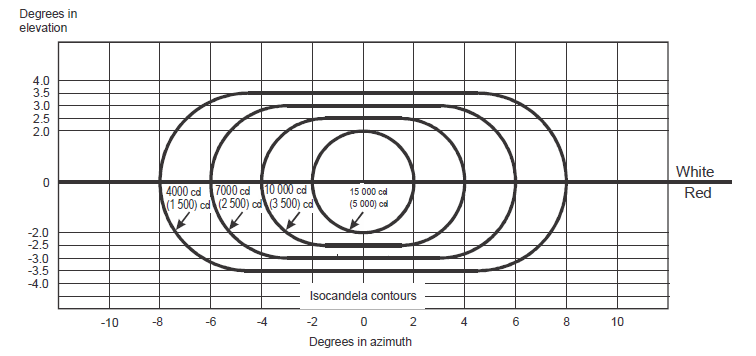
Figure U-26.
Light intensity distribution of PAPI and APAPI
Notes:
(a) These curves are for minimum intensities in red light.
(b) The intensity value in the white sector of the beam is no less than 2 and may be as high as 6.5 times the corresponding intensity in the red sector.
(c) The intensity values shown in brackets are for APAPI.
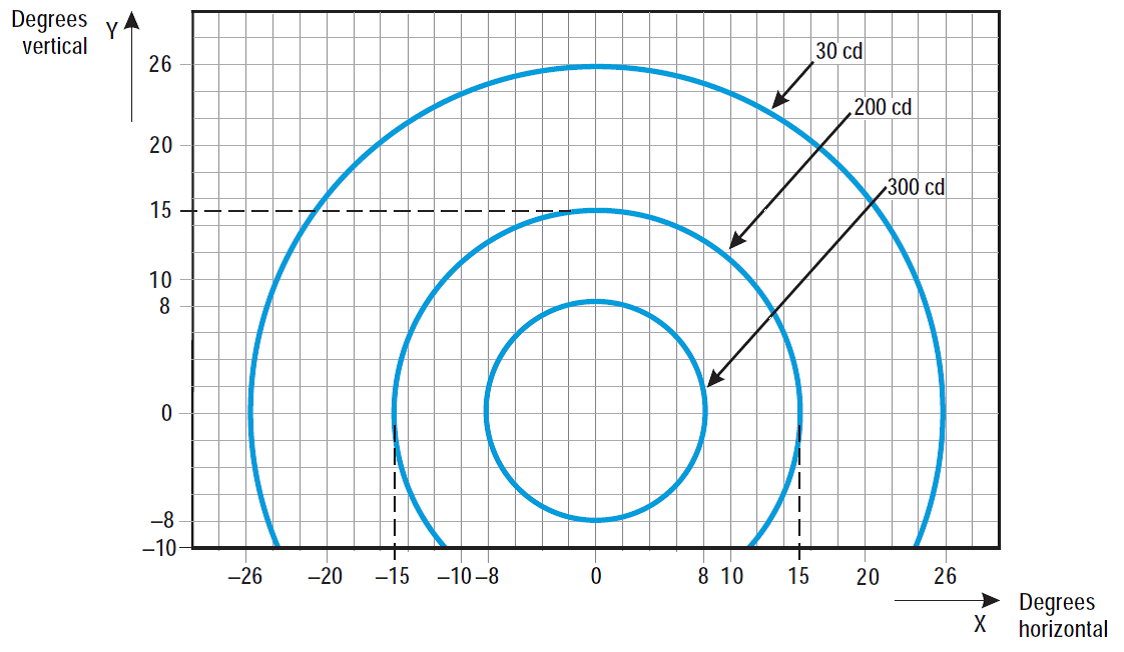
Figure U-27.
Isocandela diagram for each light in low-intensity runway guard lights,
Configuration A
Notes:
(a) Although the lights flash in normal operation, the light intensity is specified as if the lights were fixed for incandescent lamps.
(b) The intensities specified are in yellow light.
Figure U-28.
Isocandela diagram for each light in high-intensity runway guard lights,
Configuration A
Notes:
(a) Although the lights flash in normal operation, the light intensity is specified as if the lights were fixed for incandescent lamps.
(b) The intensities specified are in yellow light.
Figure U-29. Isocandela diagram for take-off and hold lights (THL) (red light)
Notes:
(a) Curves calculated on formula
|
a |
5.0 |
7.0 |
|
b |
4.5 |
8.5 |

(b) See collective notes for Figures U-5 to U-15 and Figure U-29
[Issue: ADR-DSN/3]
[Issue: ADR-DSN/4]