Light
Dark
System
Log In
Loading...
Compare / EASA/
Incorporated Amendments
/
Compare & Highlight Differences
Appendix B to AMC 20-21 Examples of Typical EZAP Worksheets
Available versions for ERULES-1963177438-99998
ED Decision 2008/007/R
found in: AMC-20 Amdt 21 - Airworthiness of Products, Parts and Appliances (Apr 2021)
Select original version
...21)
...22)
...21)
Original Text
Select changed version
...21)
...22)
...21)
Changed text
Removed: 0
Added: 0
Unchanged: 0
Share
Appendix B to AMC 20-21 Examples of Typical EZAP Worksheets ED Decision 2008/007/R The following worksheets are provided as an example to assist implementation of the EZAP logic explained in this AMC. These may be adjusted by the analyst to suit specific applications. 1. Details of Zone. 2. Assessment of Zone Attributes. 3A. Inspection Level Determination based on Rating Tables (for use where a dedicated ZIP exists). 3B. Inspection Level Determination based on Rating Tables (for use where no dedicated ZIP exists). 4. Interval Determination based on Rating Tables. 5. Task Summary. In particular, the interval ranges quoted in the rating table on Sheet 4 are solely to explain a typical arrangement of values. For a particular application, these must be compatible with the interval framework used in the existing maintenance or inspection programme. They may be expressed in terms of usage parameter (e.g. flight hours or calendar time) or in terms of letter check (as in the example).   ![Aviation.Bot AI suggestion, not from EASA source: This image displays "Sheet 3A of 5" of an Enhanced Zonal Analysis worksheet, detailing the process for determining the inspection level for wiring within an aircraft zone based on zone size, density, and the potential impact of fire, specifically for programs with a dedicated Zonal Inspection Program (ZIP). Detailed Description: The worksheet is structured with a header, two assessment tables, a decision flowchart, and an "Answers & Explanation" section. The header at the top left reads "Enhanced Zonal Analysis - Inspection Level Determination based on Zone Size, Density, Potential Impact of Fire" followed by "For Programs with dedicated Zonal Inspection Program (ZIP)". The top right corner indicates "Sheet 3A of 5". Below the header, two input fields are present: "ZONE NO:" on the left and "ZONE DESCRIPTION" on the right, both followed by an empty line for input. Two primary assessment tables are centrally located: 1. **"Zone Size/Density Assessment"**: This table, with a light blue header, is a 3x3 matrix. * Column headers are "Low", "Med/Low", and "High". * Row headers are "Low", "Med/Low", and "High". * The cell at the intersection of "Low" row and "Low" column contains "1". * All other eight cells contain "X". * Below this table, the instruction "Circle appropriate result and answer questions in Boxes below." is provided, followed by "MINIMUM:" and an empty line. 2. **"Inspection Level Determination Based on Potential Effect of Fire In Zone"**: This table, also with a light blue header, is a 3x3 matrix. * Column headers are "1", "2", and "3". * Row headers are "Low", "Med/Low", and "High". * The cells in the "Low" row (across columns "1", "2", and "3") all contain "Zonal GVI". * The cell at "Med/Low" row, "1" column contains "Zonal GVI". * The cells at "Med/Low" row, "2" column and "Med/Low" row, "3" column both contain "Zonal GVI > HZonal GVI, or HZonal GVI augmented with HZonal NWI to include wiring". * All three cells in the "High" row (across columns "1", "2", and "3") contain "Zonal GVI > HZonal GVI, or HZonal GVI augmented with HZonal NWI to include wiring". * Below this table, the instruction "Circle appropriate result and answer questions in Boxes below." is provided. A large, solid black arrow points downwards from the area below the two tables, indicating a flow into the decision flowchart. The flowchart section consists of five interconnected boxes: * **Box 1 (Diamond-shaped decision box):** "1. Is a Zonal NWI alone adequate for the entire Zone?" * A "Yes" path (arrow) leads right to Box 2. * A "No" path (arrow) leads downwards to Box 3. * **Box 2 (Rectangular process box):** "2. List area description and justification for Zonal NWI." * An arrow leads right from Box 2 to Box 4. * **Box 3 (Rectangular process box):** "3. Zonal NWI must be augmented with HZonal NWI, and/or DET Inspection." * An arrow leads right from Box 3 to Box 4. * **Box 4 (Rectangular process box):** "4. Further explain the justification for the areas for which HZonal NWI is justified." * An arrow leads right from Box 4 to Box 5. * **Box 5 (Rectangular process box):** "5. Further explain the justification for the areas for which DET Inspection is justified." Below the flowchart, specific instructions are given: * "If answer to Box 1 is 'Yes', answer Box 2 only." * "If answer to Box 1 is 'No', answer Boxes 3, & 4." The right side of the lower half of the sheet contains an "Answers & Explanation:" section with six numbered paragraphs and a concluding note: * **1.** "The tables on this Sheet are used to select the appropriate level of inspection for the wiring in the zone based on an assessment of zone size, density, and potential effects of fire in the zone." * **2.** "This worksheet is designed for operators whose existing maintenance program already includes a dedicated Zonal Inspection Program. It is assumed that an existing ZIP already includes a Zonal GVI of all zones that contain wiring, and that the wiring is included in the Zonal GVI." * **3.** "The minimum outcome of this analysis will always be a Zonal GVI of any zone where the presence of combustible materials is possible and/or wiring is located in close proximity to both primary and backup hydraulic or mechanical flight controls." * **4.** "The Inspection Level Determination Table allows the Analyst to determine if a Zonal GVI alone is adequate for all wiring in the zone, or if the Zonal GVI must be augmented with a Stand-alone GVI and/or a DET Inspection of some portion of the wiring." * **5.** "If a Zonal GVI is adequate for all wiring in the zone, the analyst must identify the inspection area as the zone itself (Box 2). Interval selection will be made on Sheet 4." * **6.** "If a Zonal GVI is not adequate for all wiring in the zone, in addition to identifying the Zonal GVI (Box 2), the analyst must also identify the specific item s/areas in the zone where a Stand-alone GVI (Box 3) and/or a DET Inspection (Box 4) is justified." * **Note:** "Note: While it is useful to know the existing Zonal GVI interval while conducting this analysis, it is not assumed that the Zonal GVI interval selected during this analysis with respect to wiring will be the same as the existing interval. During task consolidation after completion of the analysis, the most frequent Zonal GVI interval for the zone will take precedent." The footer at the bottom left reads "EZAP Worksheet" and at the bottom right "Date:" followed by an empty line. Contextual Linkage: The two assessment tables ("Zone Size/Density Assessment" and "Inspection Level Determination Based on Potential Effect of Fire In Zone") are used in conjunction to determine the initial inspection level. The outcome of these tables then feeds into the flowchart, which guides the analyst through a decision process regarding the adequacy of a Zonal NWI (likely Zonal General Visual Inspection, GVI, as per the explanation) for the entire zone. The "Answers & Explanation" section provides the rationale and instructions for using the tables and flowchart, clarifying terms like "Zonal GVI," "HZonal GVI," and "HZonal NWI," and detailing the required actions based on the flowchart's paths (referencing Box 2, Box 3, and Box 4). The mention of "Sheet 4" indicates a continuation of the process for interval selection. "mermaid graph TD subgraph Flowchart A{1. Is a Zonal NWI alone adequate for the entire Zone?} B[2. List area description and justification for Zonal NWI.] C[3. Zonal NWI must be augmented with HZonal NWI, and/or DET Inspection.] D[4. Further explain the justification for the areas for which HZonal NWI is justified.] E[5. Further explain the justification for the areas for which DET Inspection is justified.] A -- "Yes" --> B A -- "No" --> C B --> D C --> D D --> E end "](file_wSyEACTCE2d/image032.png) ![Aviation.Bot AI suggestion, not from EASA source: This image displays a worksheet titled "Enhanced Zonal Analysis - Inspection Level Determination based on Zone Size, Density, Potential impact of Fire For Programs without dedicated Zonal Inspection Program (ZIP)", designated as "Sheet 3B of 5", which guides the determination of inspection levels for aircraft zones. Detailed Description: The worksheet is structured into several distinct sections: 1. **Header Information:** * At the top left, the main title "Enhanced Zonal Analysis - Inspection Level Determination based on Zone Size, Density, Potential impact of Fire For Programs without dedicated Zonal Inspection Program (ZIP)" is displayed. * At the top right, "Sheet 3B of 5" indicates the page number within a larger document. * Below the main title, two blank fields are provided for input: "ZONE NO:" and "ZONE DESCRIPTION:". 2. **Zone Size/Density Assessment Table:** * Located on the left side of the upper half, this is a black rectangular table with a white border, titled "Zone Size/Density Assessment". * It features three columns labeled "Very Small", "Small/Medium", and "Large". * It has three rows labeled "Low", "Medium", and "High". * Each cell within the table contains an 'X' mark. * Below the table, the instruction "Circle appropriate result and Insert below." is provided, followed by a blank line and the label "MINIMUM:". 3. **Inspection Level Determination Based on Potential Effect of Fire in Zone Table:** * Located on the right side of the upper half, this is a black rectangular table with a white border, titled "Inspection Level Determination Based on Potential Effect of Fire in Zone". * It features three columns labeled "1", "2", and "3". * It has four rows. The first row is labeled "High (Combustible Material)". The subsequent three rows are labeled "Low", "Medium", and "High". * The cells contain text descriptions of inspection levels: * Row "Low": All three columns state "GVI of all wiring in the zone at the same interval". * Row "Medium": * Column "1": "GVI of all wiring in the zone at the same interval" * Column "2": "GVI of all wiring in the zone at the same interval > GVI of some wiring" * Column "3": "GVI of all wiring in the zone at the same interval > GVI of some wiring > DET of some wiring" * Row "High": * Column "1": "GVI of all wiring in the zone at the same interval" * Column "2": "GVI of all wiring in the zone at the same interval > GVI of some wiring > DET of some wiring" * Column "3": "GVI of all wiring in the zone at the same interval > GVI of some wiring > DET of some wiring > MHR of some wiring" * Below the table, the instruction "Circle appropriate result and answer questions in Boxes below." is provided. 4. **Flowchart Section:** * A downward arrow originates from the area below the "Zone Size/Density Assessment" table, leading to a series of interconnected boxes. * **Box 1 (Decision):** "1. Is a GVI of all wiring in the zone at the same interval adequate?" * An arrow labeled "Yes" points from Box 1 to Box 2. * An arrow labeled "No" points from Box 1 to an intermediate process box. * **Intermediate Process Box (Result of 'No'):** "GVI of all wiring inadequate. GVI of all wiring at a more frequent interval and/or DET is justified." * Arrows point from this box to Box 2, Box 3, and Box 4. * **Box 2 (Process):** "2. Is a GVI of all wiring in the zone at the same interval justified?" * An arrow points from Box 2 to Box 3. * **Box 3 (Process):** "3. Establish a specific GVI of all wiring in the zone at a more frequent interval as justified." * An arrow points from Box 3 to Box 4. * **Box 4 (Process):** "4. Establish a specific DET of all wiring in the zone as justified." * Below the flowchart, an instruction clarifies the flow: "If answer to Box 1 is 'Yes', answer Box 2 only. If answer to Box 1 is 'No', answer Boxes 2, 3, & 4." 5. **Answers & Explanation Section:** * Located on the right side of the lower half, this is a large white rectangular box with a black border, titled "Answers & Explanation". * It contains four numbered paragraphs: * **1.** "The tables on this sheet are used to select an Inspection Level based on zone size, density, and potential effect of fire in the zone. These factors are used to determine if a GVI of all wiring in the zone at the same interval is adequate, or if some wiring requires a more frequent GVI, or even a DET inspection." * **2.** "This worksheet is designed for operators whose existing maintenance program does not include a dedicated Zonal Inspection Program. The minimum outcome of this analysis will always be a GVI of all wiring in any zone where the presence of combustible materials is possible and/or wiring is located in close proximity to both primary and backup hydraulic or mechanical flight controls." * **3.** "If a GVI of all wiring in the zone at the same interval is adequate, the analyst must identify the inspection requirement as 'GVI of all wiring in the zone' (Box 2) and proceed to Sheet 4 to determine the GVI interval." * **4.** "If a GVI of all wiring in the zone at the same interval is not adequate, then the analyst must identify the specific items/areas in the zone where a more frequent GVI (Box 3) and/or a DET Inspection (Box 4) is justified." 6. **Footer:** * At the bottom left, "© 2008 EASA. All rights reserved." is displayed. * At the bottom right, "Printed:" followed by a blank line. Contextual Linkage: The worksheet guides an analyst through a process of determining appropriate inspection levels for aircraft zones. The "Zone Size/Density Assessment" table is used to classify a zone based on its physical attributes. This classification, combined with the "Potential Effect of Fire in Zone" (which considers combustible material presence), informs the initial selection of an inspection level from the right-hand table (e.g., General Visual Inspection (GVI), Detailed Inspection (DET), Maintenance Heavy Repair (MHR)). The subsequent flowchart then refines this initial determination by posing a critical question regarding the adequacy of a GVI for all wiring at the same interval. Depending on the answer, the flowchart directs the analyst to either confirm the GVI requirement (Box 2) or to establish more frequent GVIs (Box 3) and/or DET inspections (Box 4) for specific items or areas, especially if the initial GVI is deemed inadequate. The "Answers & Explanation" section provides the rationale and specific instructions for using the tables and flowchart, emphasizing its application for maintenance programs without a dedicated Zonal Inspection Program. Mermaid Flowchart: "mermaid graph TD A[Zone Size/Density Assessment] --> B{1. Is a GVI of all wiring in the zone at the same interval adequate?} B -- Yes --> C[2. Is a GVI of all wiring in the zone at the same interval justified?] B -- No --> D[GVI of all wiring inadequate. GVI of all wiring at a more frequent interval and/or DET is justified.] D --> C D --> E[3. Establish a specific GVI of all wiring in the zone at a more frequent interval as justified.] D --> F[4. Establish a specific DET of all wiring in the zone as justified.] C --> E E --> F "](file_wSyEACTCE2d/image033.png) ![Aviation.Bot AI suggestion, not from EASA source: **Overall Summary:** This image displays a worksheet titled "Enhanced Zonal Analysis - Interval Determination Based on Hostility of Environment and Likelihood of Accidental Damage," serving as Sheet 4 of 5 in a series, designed to guide the determination of inspection intervals. **Detailed Description:** The image presents a structured form or worksheet on a white background, divided into several sections. At the top, the title "Enhanced Zonal Analysis - Interval Determination Based on Hostility of Environment and Likelihood of Accidental Damage" is centrally aligned, with "Sheet 4 of 5" positioned in the top right corner. Below the main title, two horizontal text fields are present: "ZONE NO:" on the left and "ZONE DESCRIPTION:" on the right, each followed by a black rectangular area indicating a space for input. Below these fields, a block of instructional text reads: "Interval selection is specific to each task identified on Sheet 3A or 3B. For GVI of entire zone, consider overall zone environment and likelihood of damage. For Stand-alone GVI or DET, consider environment and likelihood of damage only in respect to the specific item /area defined for inspection." Further down, two more horizontal text fields are provided: "Item /Area Defined for Inspection:" and "Inspection Level:", each followed by a black rectangular area for input. The central and largest part of the worksheet is occupied by a flowchart-like diagram consisting of three large, rectangular boxes. Each box has a light blue header bar with black text and a large black rectangular area below, representing obscured content or a table. 1. The top-left box has the header "Hostility of Environment". 2. The top-right box has the header "Likelihood of Accidental Damage". 3. The bottom-center box, positioned below and between the two top boxes, has the header "Interval Determination". Two solid black lines with arrowheads connect the top boxes to the bottom box: - One arrow originates from the bottom-center of the "Hostility of Environment" box and points downwards to the top-center of the "Interval Determination" box. - The second arrow originates from the bottom-center of the "Likelihood of Accidental Damage" box and points downwards to the top-right side of the "Interval Determination" box. Below the "Interval Determination" box, there is a small, narrow black rectangular area, possibly for a final output or signature. At the very bottom of the worksheet, a final instruction is provided: "Upon completion, enter all task and interval selections onto Sheet 5, Task Summary." **Contextual Linkage:** This worksheet, Sheet 4 of 5, is designed to determine inspection intervals by evaluating two primary factors: the "Hostility of Environment" and the "Likelihood of Accidental Damage." The flowchart visually represents that both these factors are inputs that feed into the "Interval Determination" process. The instructions clarify that interval selection is task-specific, with different considerations for General Visual Inspections (GVI) of an entire zone versus stand-alone GVI or Detailed Inspections (DET) of specific items or areas. The determined intervals and tasks are to be summarized on Sheet 5. "mermaid graph TD A["Hostility of Environment"] --> C["Interval Determination"] B["Likelihood of Accidental Damage"] --> C["Interval Determination"] "](file_wSyEACTCE2d/image034.png)  [Amdt AMC/4]
Appendix B to AMC 20-21 Examples of Typical EZAP Worksheets ED Decision 2008/007/R The following worksheets are provided as an example to assist implementation of the EZAP logic explained in this AMC. These may be adjusted by the analyst to suit specific applications. 1. Details of Zone. 2. Assessment of Zone Attributes. 3A. Inspection Level Determination based on Rating Tables (for use where a dedicated ZIP exists). 3B. Inspection Level Determination based on Rating Tables (for use where no dedicated ZIP exists). 4. Interval Determination based on Rating Tables. 5. Task Summary. In particular, the interval ranges quoted in the rating table on Sheet 4 are solely to explain a typical arrangement of values. For a particular application, these must be compatible with the interval framework used in the existing maintenance or inspection programme. They may be expressed in terms of usage parameter (e.g. flight hours or calendar time) or in terms of letter check (as in the example). 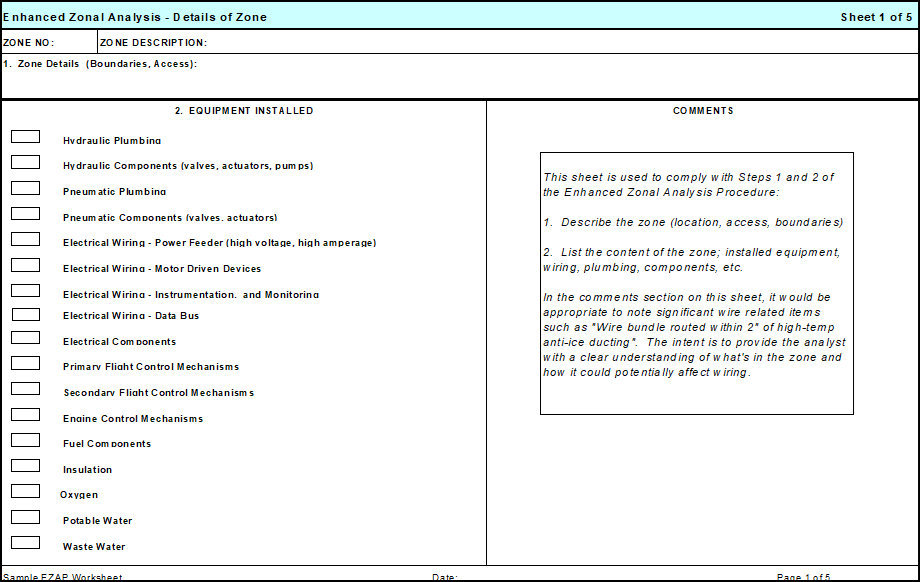  ![Aviation.Bot AI suggestion, not from EASA source: Overall Summary: The image is a structured worksheet for Enhanced Zonal Analysis, specifically for determining inspection levels based on zone size, density, and potential impact of fire, intended for use with dedicated Zonal Inspection Programs (ZIP) in aviation maintenance. Detailed Description: The worksheet is divided into several clearly delineated sections, each with specific headings, tables, and flowchart elements. The primary sections are as follows: 1. **Header Section (Top of Image):** - Contains the title: "Enhanced Zonal Analysis - Inspection Level Determination based on Zone Size, Density, Potential Impact of Fire" - Sheet identifier: "Sheet 3A of 6" - Subheading: "For Programs with dedicated Zonal Inspection Program (ZIP)" - Two labeled fields: "ZONE NO:" and "ZONE DESCRIPTION" (both with blank spaces for user input). 2. **Main Assessment Tables (Upper Half):** - **Left Table: "Zone Size/Density Assessment"** - Four columns labeled: "Small/Low," "Medium/Medium," "Large/High," and "Extensive/Very High." - Four rows labeled: "No. of Items," "Area (m²)," "No. of Items per m²," and "Wiring Density." - Each cell contains a range or qualitative descriptor (e.g., "<10," "10-30," "30-60," ">60" for "No. of Items"). - A note below the table: "(Circle the appropriate value; the result will be used in the flowchart below.)" - **Right Table: "Inspection Level Determination Based on Potential Effect of Fire in Zone"** - Five columns labeled: "I," "II," "III," "IV," "V." - Each column header includes a description: "Minor/No Safety Effect," "Major," "Hazardous," "Catastrophic," "Extensive/Multiple." - Each cell contains a recommended inspection level, e.g., "Zonal GVI," "Zonal GVI + Standalone GVI," "Zonal GVI + Standalone DVI," etc. - A note below the table: "Circle appropriate result and answer questions in Boxes below." 3. **Flowchart Section (Lower Left):** - Box 1: "Is the Zonal GVI interval for the wiring the same as for the rest of the zone?" - Two arrows: "Yes" leads to Box 2, "No" leads to Box 3. - Box 2: "No further action required. Wiring is included in the Zonal GVI." - Box 3: "Is the Zonal GVI interval for the wiring less frequent than for the rest of the zone?" - Two arrows: "Yes" leads to Box 4, "No" leads to Box 5. - Box 4: "The Zonal GVI interval for the wiring must be augmented with a Standalone GVI at the required interval." - Box 5: "The Zonal GVI interval for the wiring must be augmented with a Standalone DVI at the required interval." - Instruction below: "If answer to Box 1 is 'Yes' - answer Box 2 only. If answer to Box 1 is 'No', answer Boxes 3, 4, 5." 4. **Answers & Explanations Section (Lower Right):** - Numbered explanations (1 to 5) clarify the use of the tables and flowchart: 1. Explains the purpose of the tables for selecting inspection levels. 2. Describes the worksheet's intended use for programs with existing Zonal GVI. 3. Details the logic for determining if Standalone GVI or DVI is needed. 4. Explains the use of the worksheet for identifying the Zonal GVI interval. 5. Clarifies the precedence of the most frequent Zonal GVI interval. 5. **Footer:** - Small text: "EZAP Example Sheet" and "Public." Contextual Linkage: - The worksheet is designed to guide the analyst through a stepwise process: - First, the zone's size and density are assessed using the left table, with the appropriate value circled. - Next, the potential effect of fire in the zone is assessed using the right table, again circling the appropriate result. - The circled results inform the analyst which inspection level is required for the wiring in the zone. - The flowchart below is then used to determine if the Zonal GVI interval for wiring matches the rest of the zone, and if not, whether Standalone GVI or DVI is required. - The numbered explanations provide detailed guidance on how to interpret and apply the results from the tables and flowchart. Mermaid Markdown (Flowchart Only): "mermaid flowchart TD A["[1. Is the Zonal GVI interval for the wiring the same as for the rest of the zone?]"] -->|[Yes]| B["[2. No further action required. Wiring is included in the Zonal GVI.]"] A -->|[No]| C["[3. Is the Zonal GVI interval for the wiring less frequent than for the rest of the zone?]"] C -->|[Yes]| D["[4. The Zonal GVI interval for the wiring must be augmented with a Standalone GVI at the required interval.]"] C -->|[No]| E["[5. The Zonal GVI interval for the wiring must be augmented with a Standalone DVI at the required interval.]"] "](file_tNNDI2wQkpg/image040.png)  ![Aviation.Bot AI suggestion, not from EASA source: The image displays a worksheet titled "Enhanced Zonal Analysis - Interval Determination Based on Hostility of Environment and Likelihood of Accidental Damage," which is Sheet 4 of 5, designed for determining inspection intervals based on environmental hostility and potential for accidental damage. Detailed Description: The image presents a structured form or worksheet with a white background and black text. At the top, the title "Enhanced Zonal Analysis - Interval Determination Based on Hostility of Environment and Likelihood of Accidental Damage" is displayed, along with "Sheet 4 of 5" in the top right corner. Below the title, there are two horizontal fields: "ZONE NO:" and "ZONE DESCRIPTION:", each followed by a black rectangular area, indicating a space for input. A paragraph of instructional text follows: "Interval selection is specific to each task identified on Sheet 3A or 3B. For GVI of entire zone, consider overall zone environment and likelihood of damage. For Stand-alone GVI or DET, consider environment and likelihood of damage only in respect to the specific item /area defined for inspection." Below this instruction, there are two more fields: "Item /Area Defined for Inspection:" and "Inspection Level:", both followed by black rectangular areas for input. The central part of the worksheet features a flowchart-like diagram composed of three main rectangular boxes and one smaller box, connected by lines with arrows. 1. The first box, on the left, has a light blue header with the text "Hostility of Environment" and a large black rectangular area below it. 2. The second box, on the right, is horizontally aligned with the first. It has a light blue header with the text "Likelihood of Accidental Damage" and a large black rectangular area below it. 3. A third, larger rectangular box is positioned below and centrally aligned with the two upper boxes. It has a light blue header with the text "Interval Determination" and a large black rectangular area below it. 4. A line with an arrow originates from the bottom center of the "Hostility of Environment" box, bends right, then downwards, and points to the top-left side of the "Interval Determination" box. 5. Another line with an arrow originates from the bottom center of the "Likelihood of Accidental Damage" box, bends left, then downwards, and points to the top-right side of the "Interval Determination" box. 6. Below the "Interval Determination" box, there is a small, narrow black rectangular area, not connected by any lines or arrows to other elements. At the very bottom of the worksheet, a final instruction is provided: "Upon completion, enter all task and interval selections onto Sheet 5, Task Summary." Contextual Linkage: The worksheet is designed to guide the user through the process of determining inspection intervals. The "Interval Determination" box receives inputs from both the "Hostility of Environment" and "Likelihood of Accidental Damage" assessments, implying that these two factors are critical inputs for calculating or selecting the appropriate interval. The instructions at the top clarify that interval selection is task-specific, and for General Visual Inspections (GVI) or Detailed Inspections (DET), the environment and likelihood of damage are considered for the specific item or area. The final output of this sheet, the determined task and interval selections, are to be transferred to "Sheet 5, Task Summary." "mermaid graph TD subgraph "Enhanced Zonal Analysis - Interval Determination Based on Hostility of Environment and Likelihood of Accidental Damage" A["Hostility of Environment"] B["Likelihood of Accidental Damage"] C["Interval Determination"] D[" "] A --> C B --> C C --> D end "](file_tNNDI2wQkpg/image042.png)  [Amdt AMC/4]
Appendix B to AMC 20-21 Examples of Typical EZAP Worksheets ED Decision 2008/007/R The following worksheets are provided as an example to assist implementation of the EZAP logic explained in this AMC. These may be adjusted by the analyst to suit specific applications. 1. Details of Zone. 2. Assessment of Zone Attributes. 3A. Inspection Level Determination based on Rating Tables (for use where a dedicated ZIP exists). 3B. Inspection Level Determination based on Rating Tables (for use where no dedicated ZIP exists). 4. Interval Determination based on Rating Tables. 5. Task Summary. In particular, the interval ranges quoted in the rating table on Sheet 4 are solely to explain a typical arrangement of values. For a particular application, these must be compatible with the interval framework used in the existing maintenance or inspection programme. They may be expressed in terms of usage parameter (e.g. flight hours or calendar time) or in terms of letter check (as in the example). 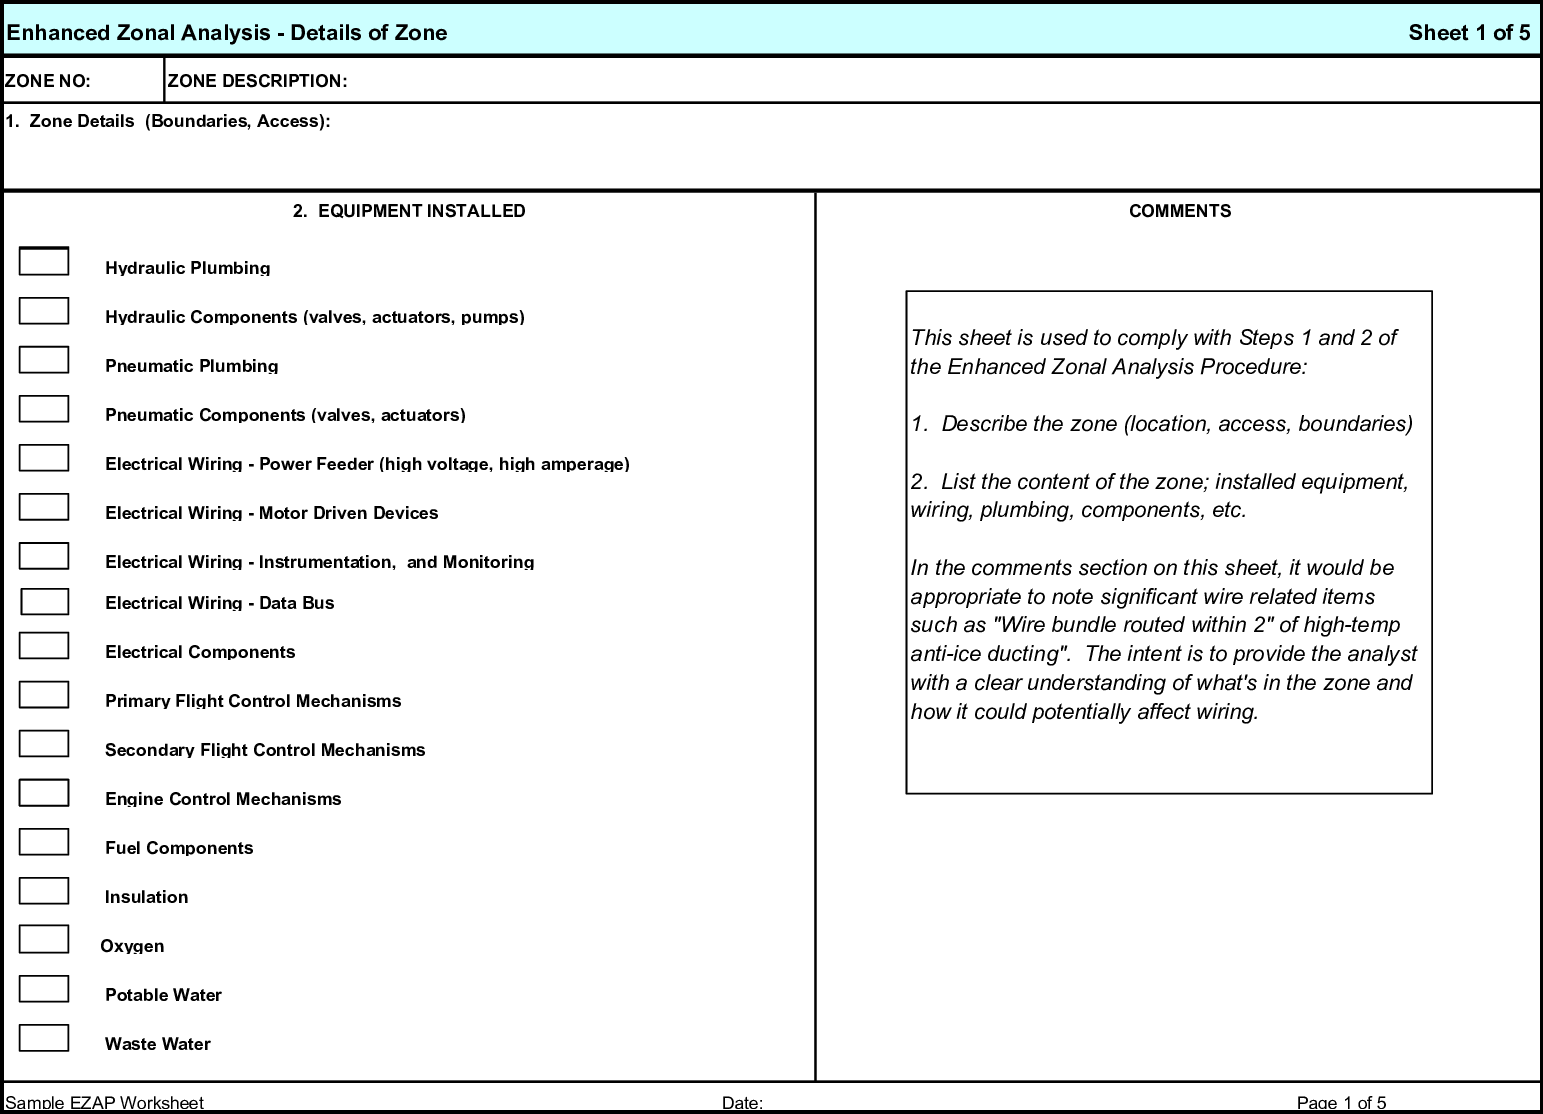 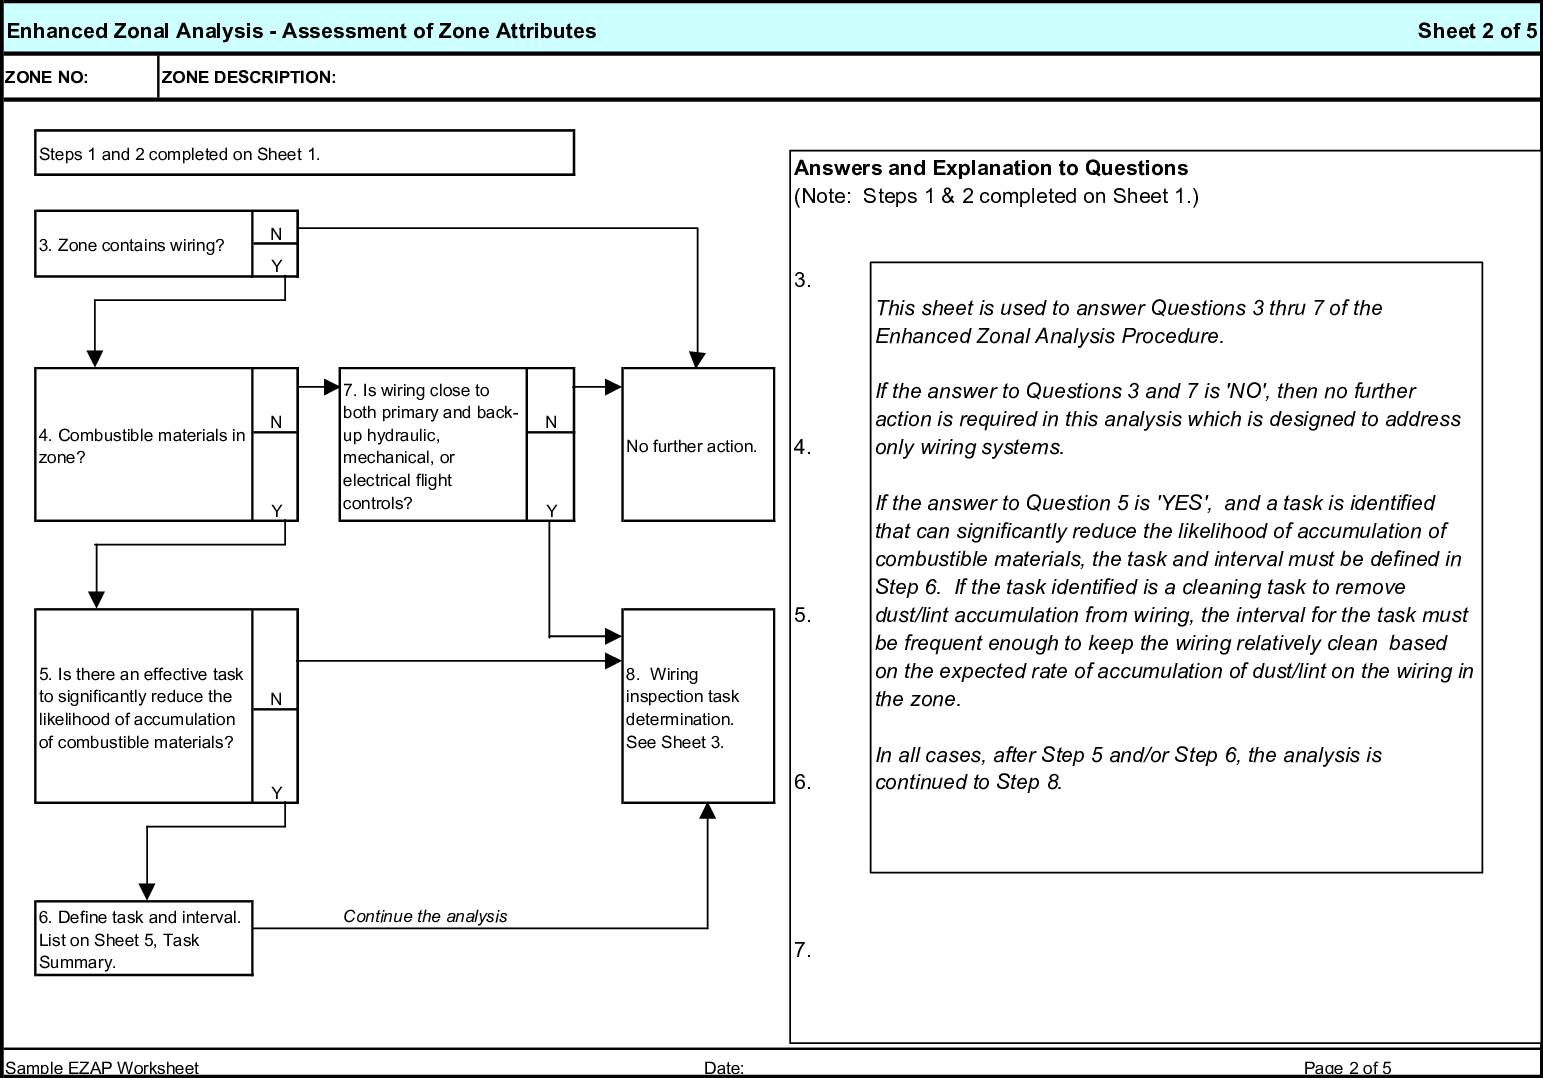 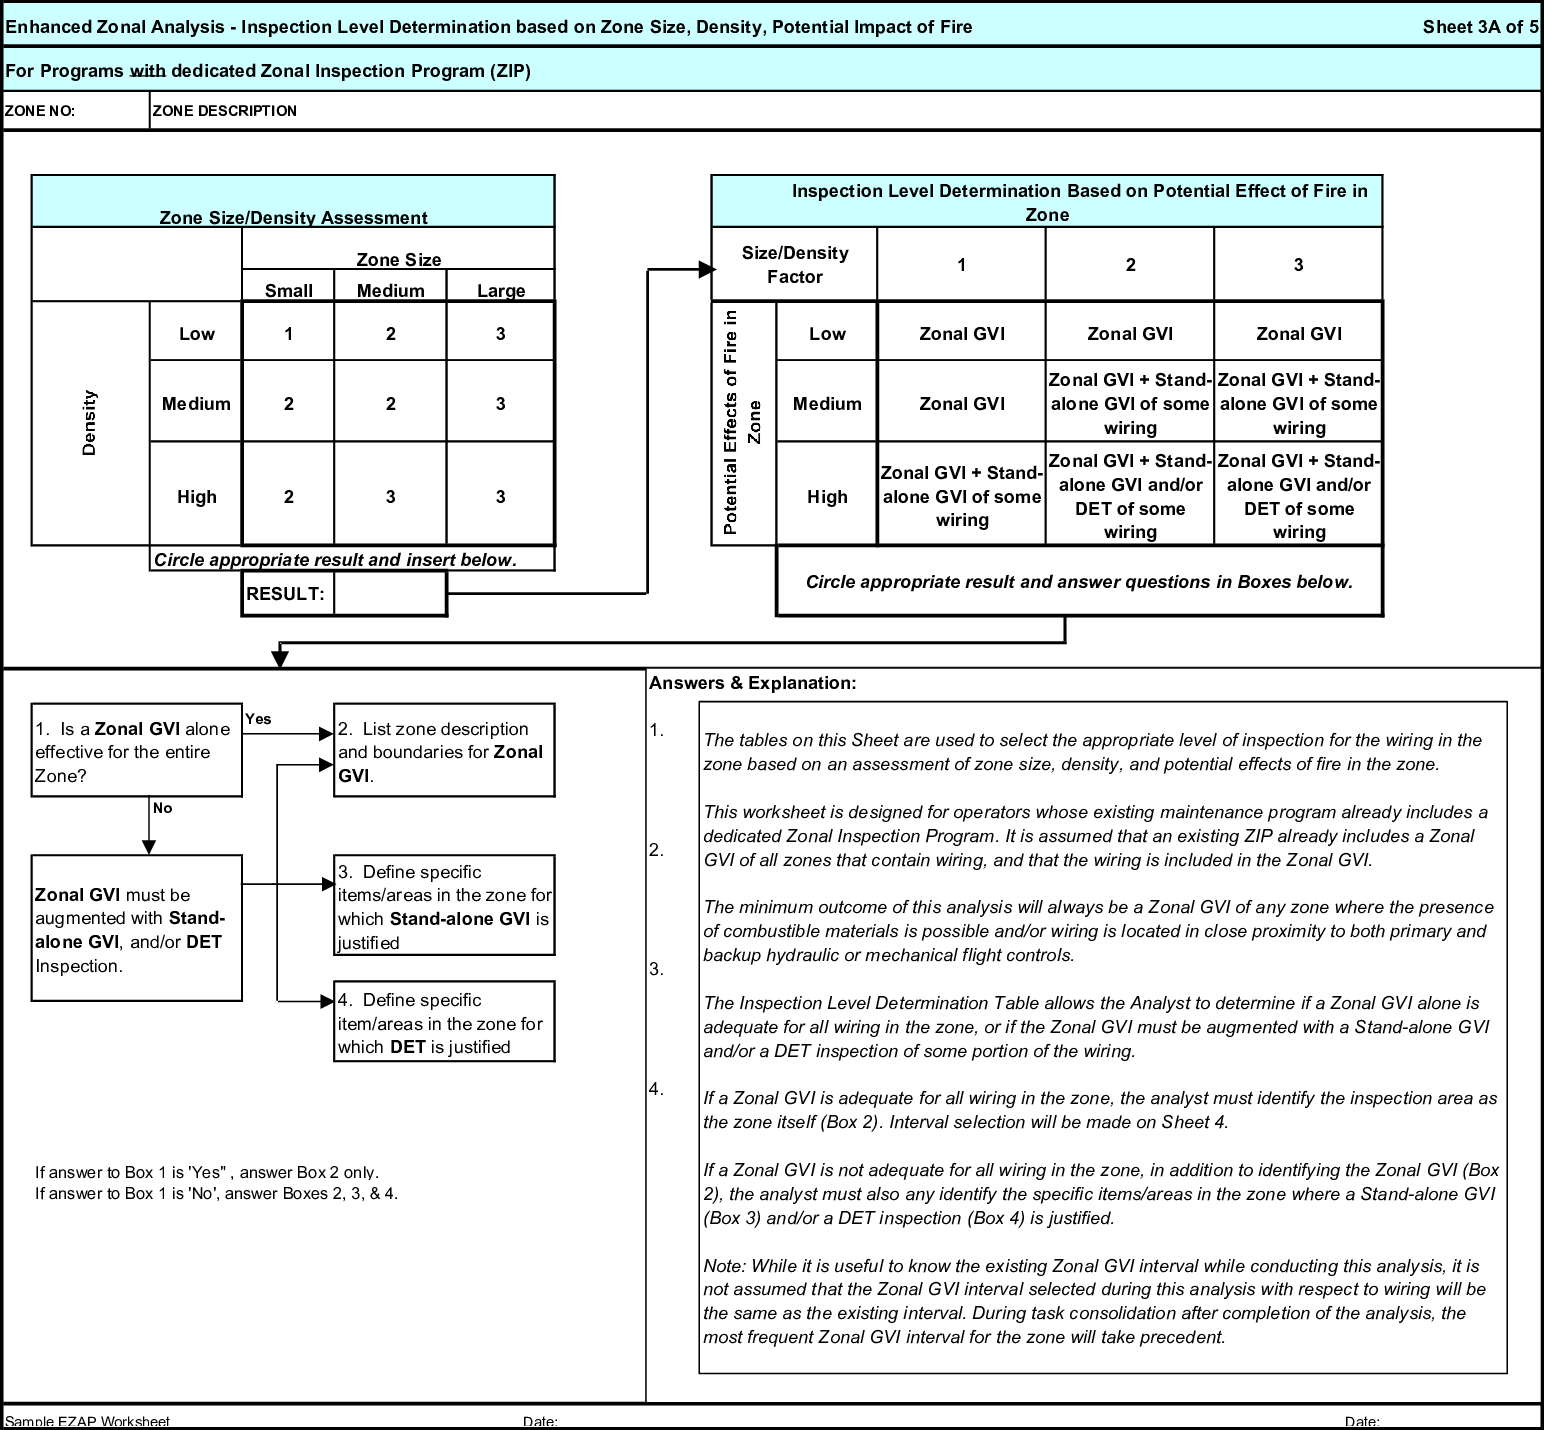 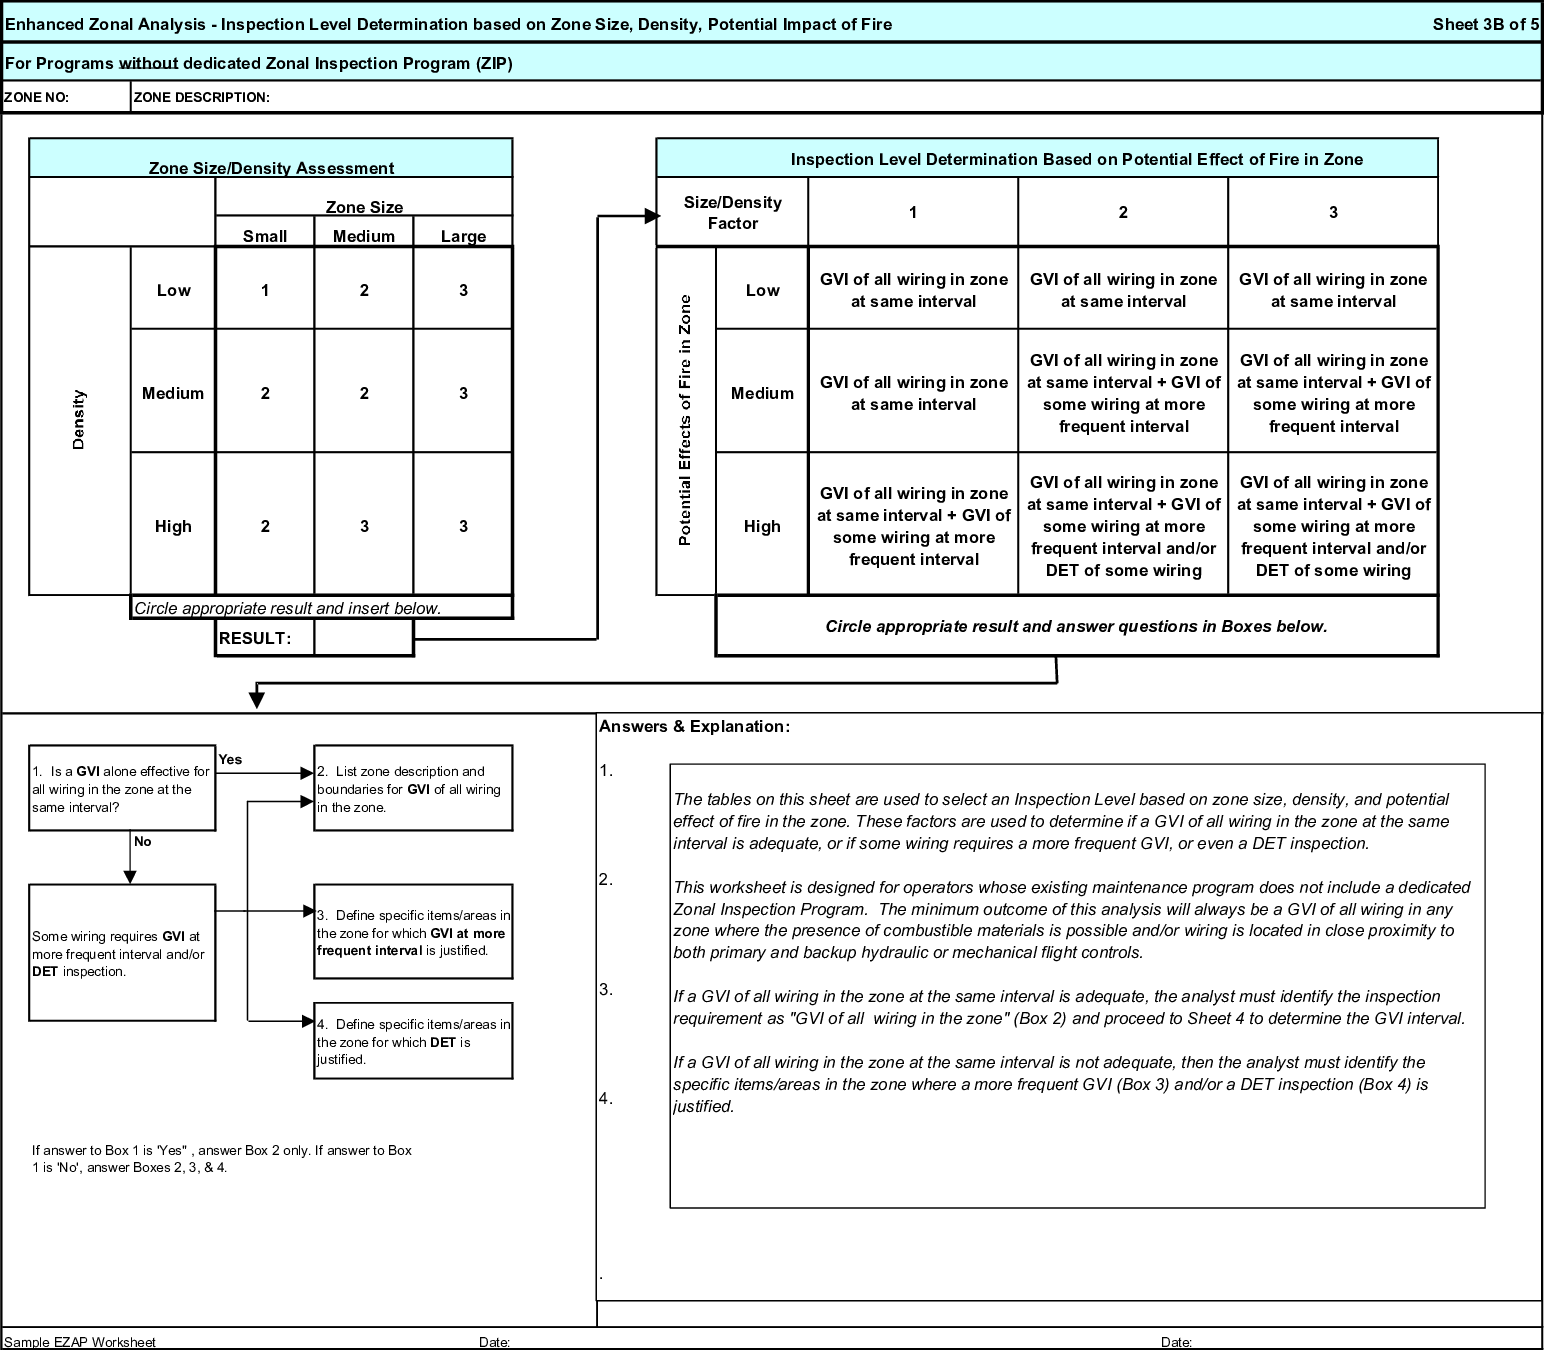 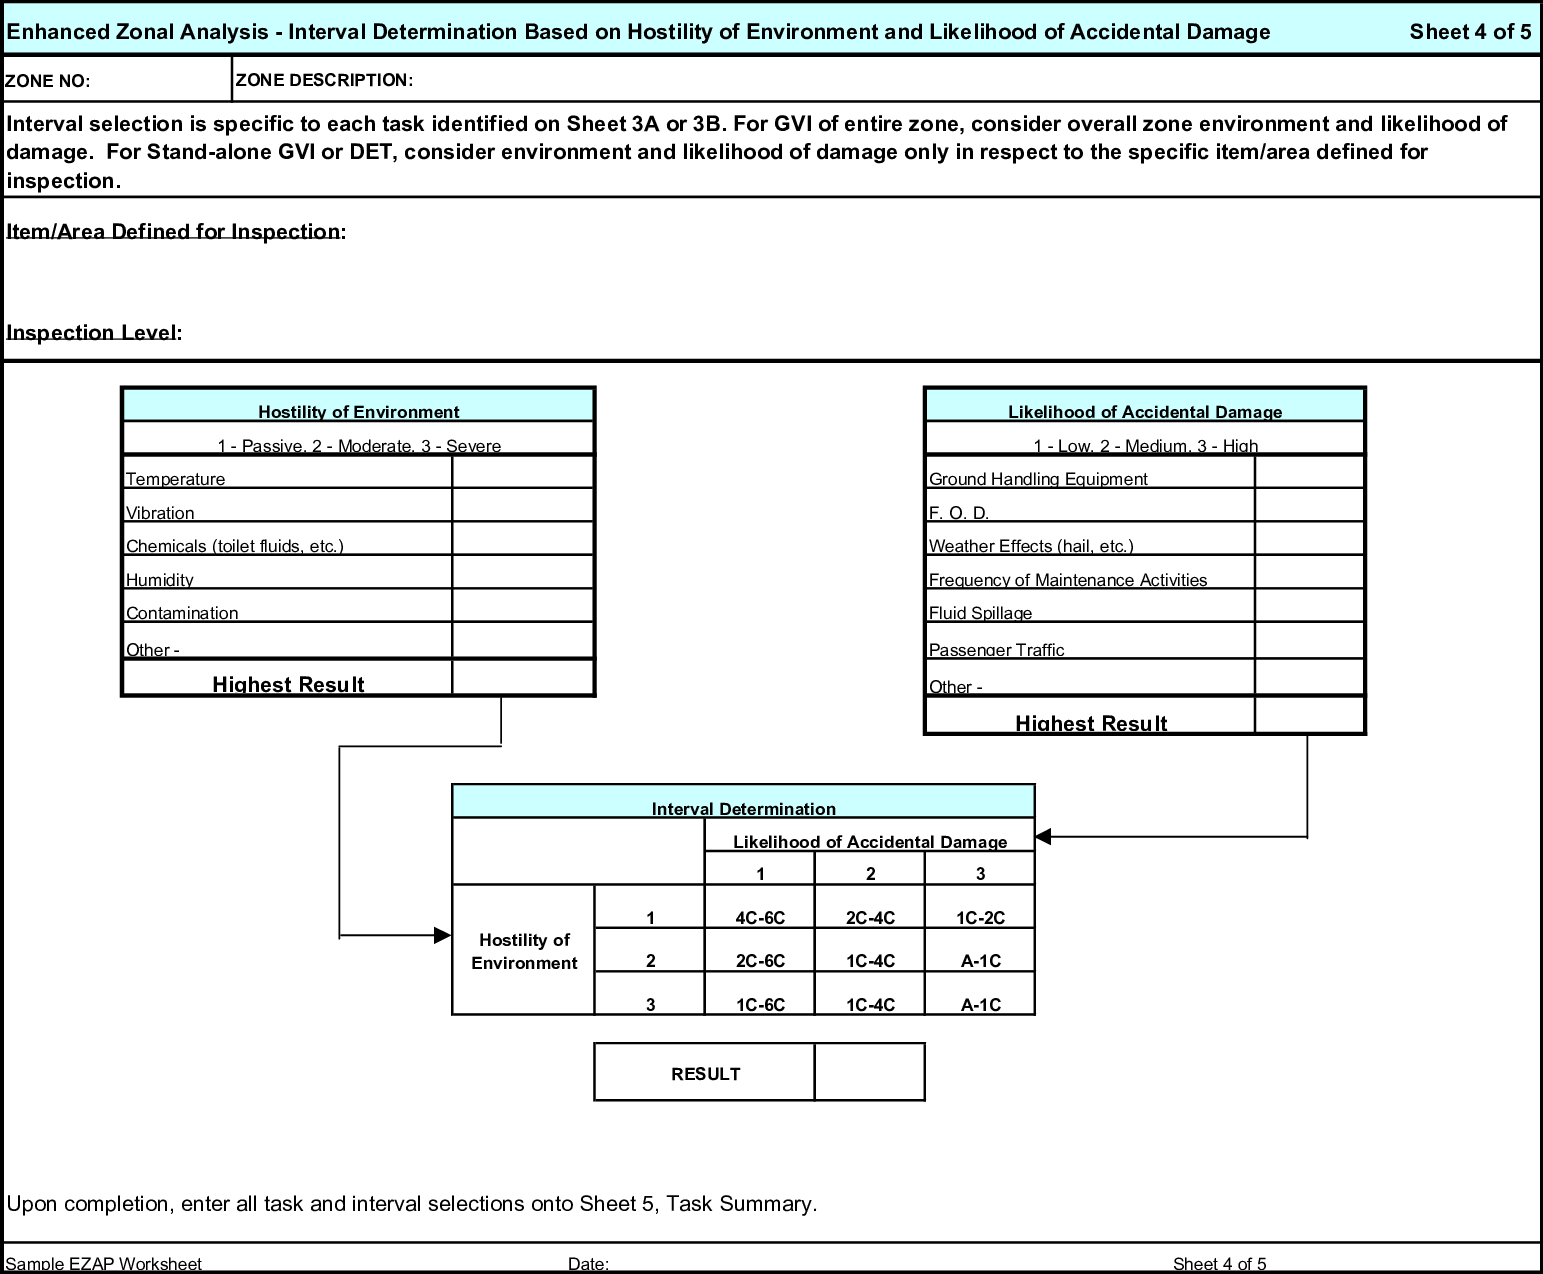 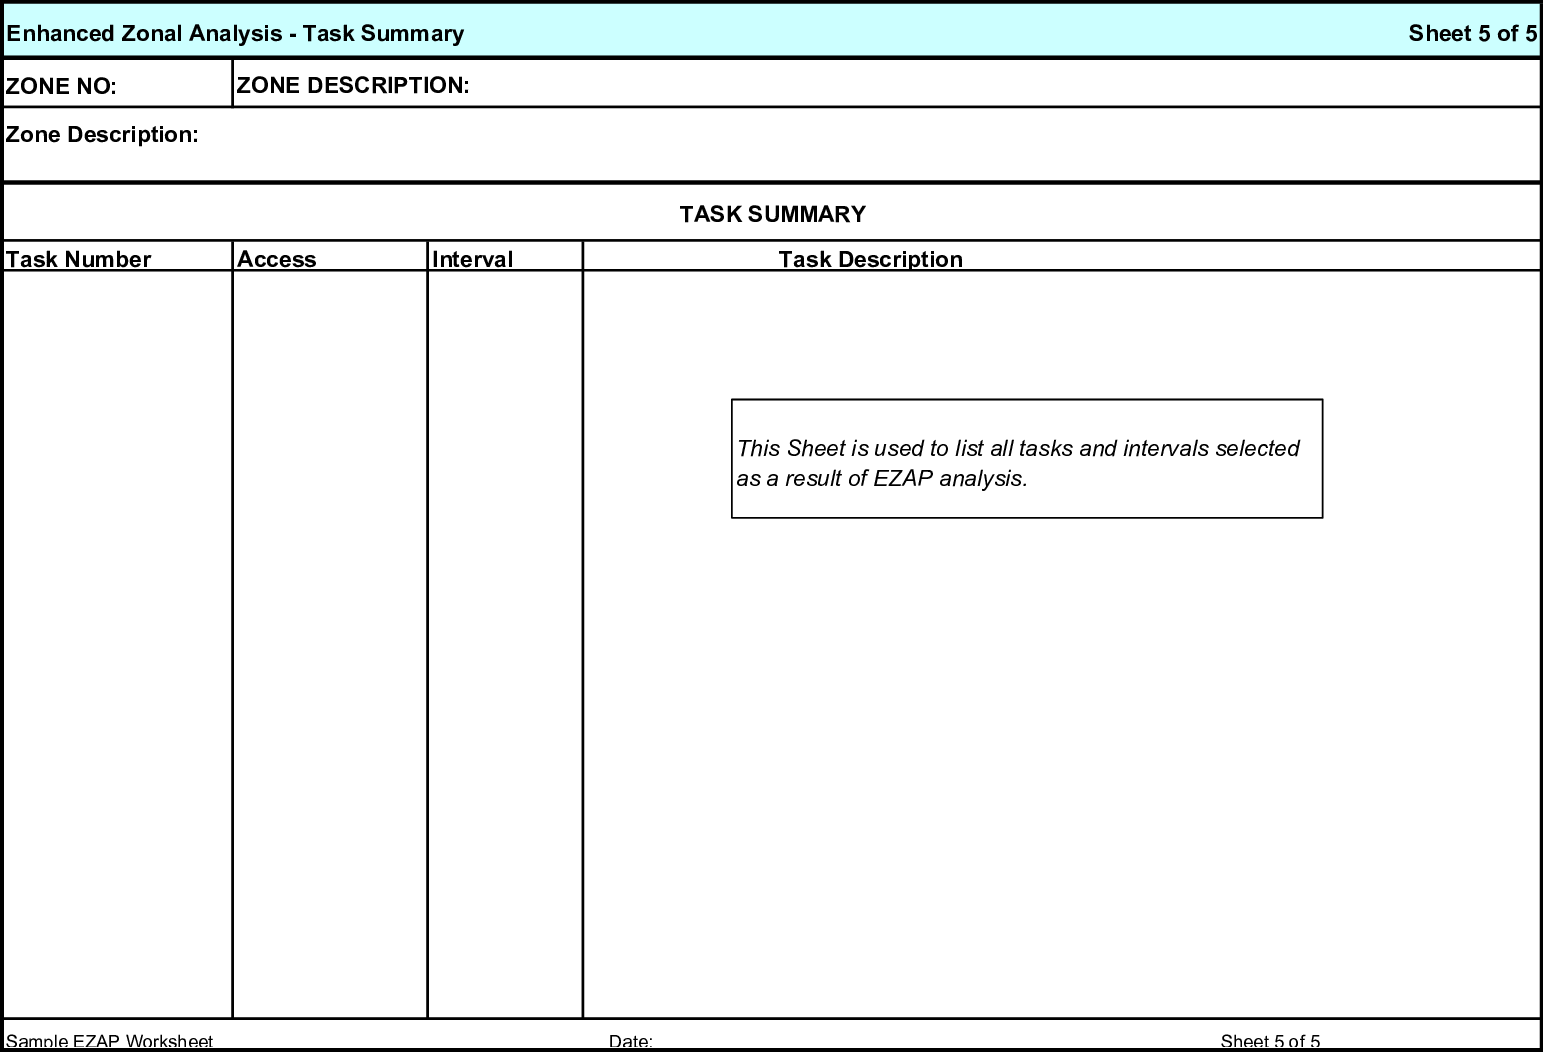 [Amdt AMC/4]